0 DTE Backtest - Entry Timing 2

Recap
Few months back I did a bunch of backtest on 0 DTE Backtest - Entry Timing. It does help to provide some historical trend data to guide how I further refine the 0 DTE strategy.
Now that OptionOmega have per minute data instead of 5 minute when I did the last time, and having more experience on trading 0 DTE. I decided to run more of such entry timing backtest, a hell lot more.
Before I throw in all the data I gathered, I just want to say that backtest data are just here to give us a guide on a possible trend. It does not mean the future will continue to remain the same.
Introduction
I did too many runs and there's really a lot of numbers, I probably can't sort out these data neat enough so bear with me on that. You can refer to the previous post to understand how I did the previous run.
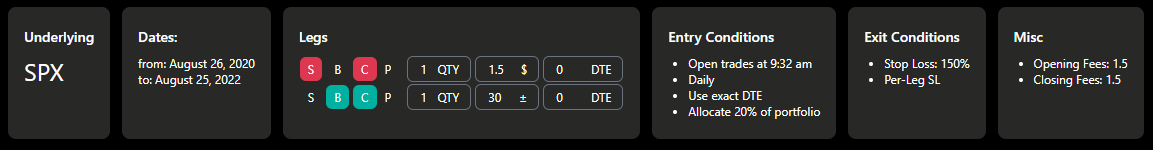
This is an example of 1 run, to set some basis reference. Just to go through some of the parameters and what I tweaked.
- $100,000 capital - to keep the numbers easier to reference
- 20% capital per trade - this is because I anticipate 2-3 tranches which scale up to 40-60% risk
- Bull Call Spread (BCS) and Bull Put Spread (BPS) - run separately
- 10 / 20 / 30 Wide Spread - mainly 20/30, 10 wide is there to see the relative comparison pattern
- 100% / 150% Stoploss on Short Leg Only - this is the best practice in my experience as it prevent spread not filling stoploss in power hour.
- Fees of $1.5 for both open and close - from my IBKR reference, it's usually around $1.2-1.3. I use $1.5 to have some slight buffer
- I ran for every 30 minute interval from 9:32 to 3:00 - because the earliest time possible in the backtest is 9:32 and I excluded power hour entry
- All runs are based on past 2 years data - Aug 2020 - Aug 2022
And the most important part.
- Sell $1.5 Leg
- Buy 10/20/30 Wide Leg
Also to give some context on what I'm trying to get out of all these. Personally, I'm trying to set my priorities to more consistency. Means I'll want to put together some of these data to refine the 0 DTE tranches strategy to a very stable, very consistent, low drawdown strategy. Because history data does not and probably will not represent what's gonna happen in the future.
Ok a lot of background story covered, let's go into the first set of data.
Bull Put Spread - 100% Stoploss set on whole spread
This set is run with stoploss on spread before I change to running stoploss on single short leg. And I only ran this on BPS only to get a sense of things. I eventually run all the rest with stoploss on short leg because that's what I figured out to be the safer and simpler approach moving forward.
Few key take away for me here:
- BPS performs the best at 1:30-2:00
- The smaller the spread width, the more inconsistent it becomes.
- Regardless of what time you enter for BPS side, you will be profitable if you keep doing it.
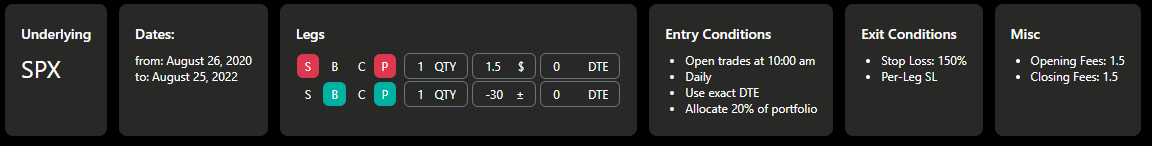
Then I move to running all the BPS side with stoploss on single short leg.
Bull Put Spread - 100% Stoploss set on Short Leg
This run showed me that be it running with stoploss on spread or short leg, the timing pattern for BPS is more or less the same. Returns overall is slightly lower due to the difference in stoploss mechanism but it's still generally profitable.
Also with this run, I start to capture the max drawdown numbers which also reflected that wider spread gives lower drawdown to the strategy.
After running this, I started asking myself, what about stoploss of 150% on short leg.
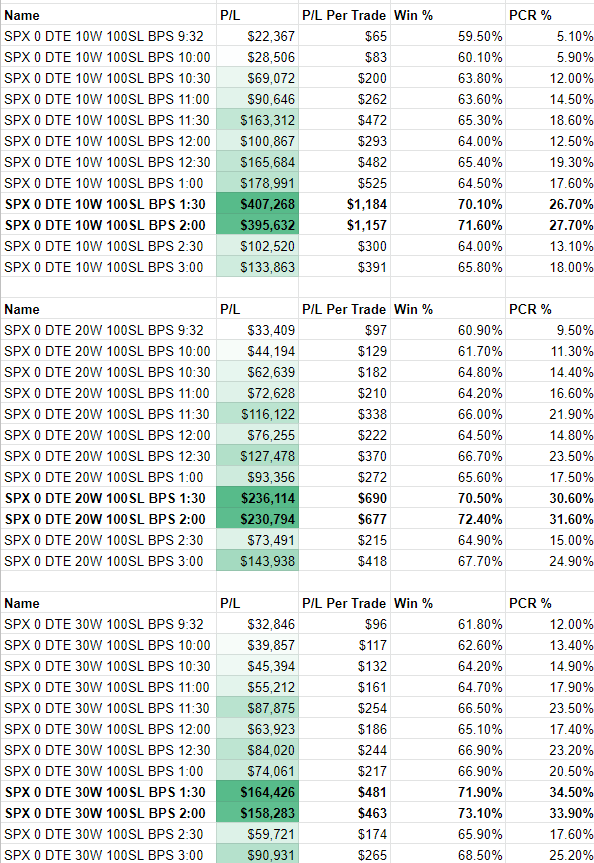
Bull Put Spread - 150% Stoploss set on Short Leg
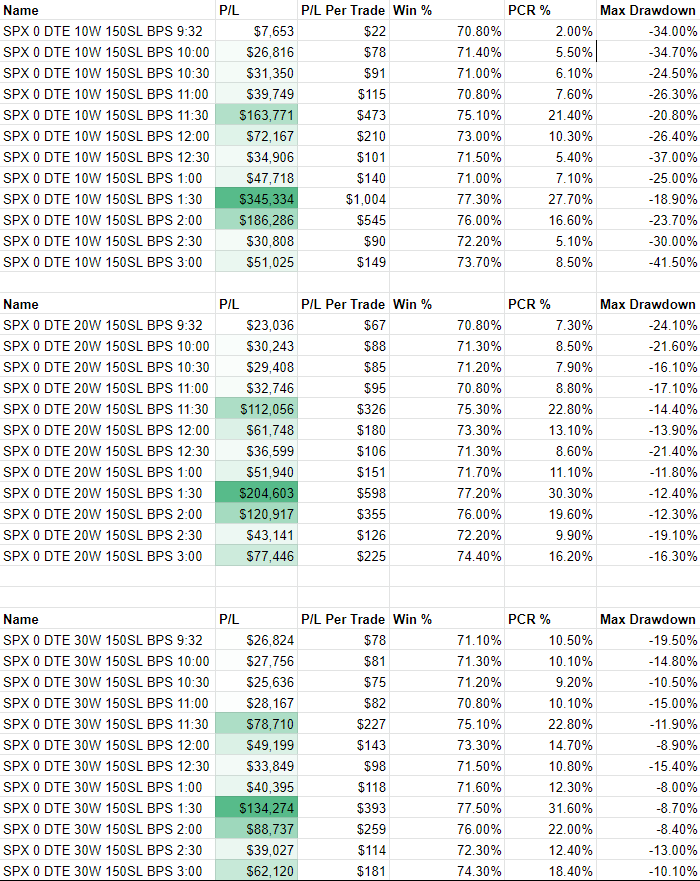
Overall the trend is still more or less the same, then I see something interesting. 150% SL on short leg actually perform slightly better than 100% SL on short leg across all timings.
Yes then I'll again ask myself what about 200% SL. But no, I did not run that because despite performance is slightly better, the drawdown starts to go higher too. Which comes back to the point on priority on consistency. So I did not run 200% SL. Just in case you also have that question in mind.
So from here, we've been only running BPS. Which gives us a pretty good trend. But with the tranches strategy, we need both BPS and BCS.
If you want to know more about the tranches, go read https://www.vocsong.com/0-dte-iron-condor-tranches-strategy/
I'll probably be writing a v2 of this soon, with this whole bunch of backtest data refining some details.
So I started running the BCS for 150% SL on Short Leg.
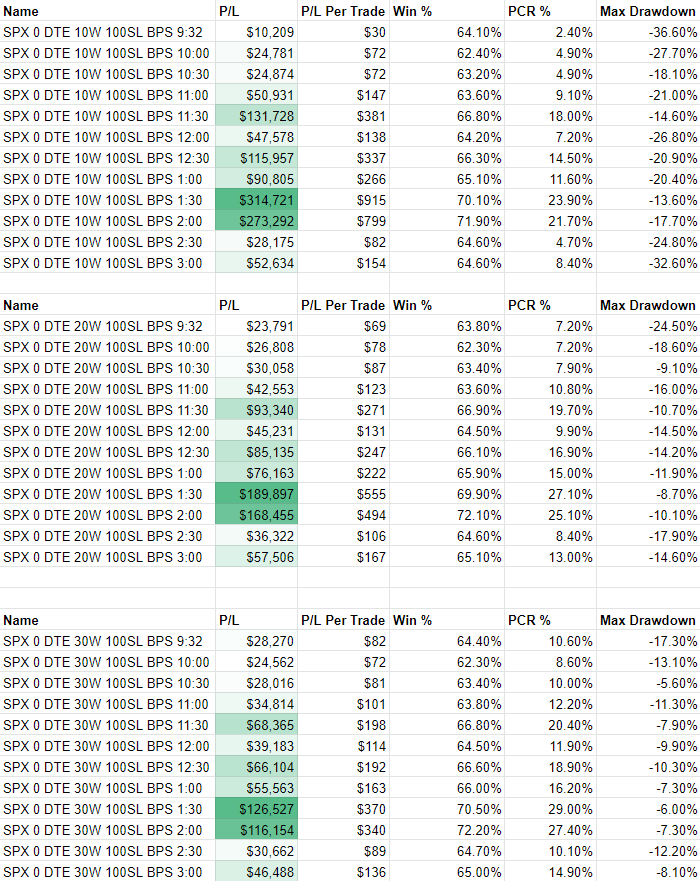
Bear Call Spread - 150% Stoploss set on Short Leg
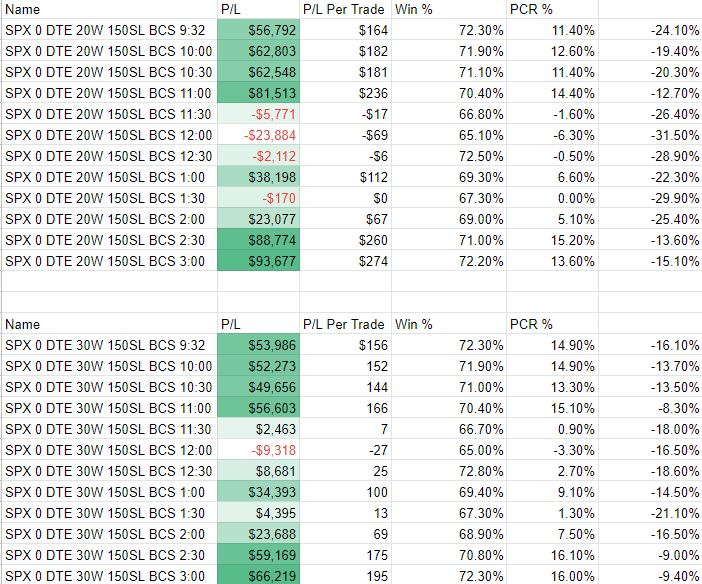
Note that I no longer run the 10 wide because it's obviously not a consistent option. It's just higher leverage with bigger drawdowns and in a smaller specific scenario of higher returns, so skip it. It's just there for reference to see when width changes what is the differences.
From BCS side, we see very obvious opposite timings compared to BPS. We also see 30 wide BCS has a much lower drawdown compared to 20 wide. All these remain consistent towards all the runs so far.
Which leads me to start thinking of putting them together for comparison and running the portfolio feature of OptionOmega.
Finding the optimal tranche timing
So combing the BPS+BCS, I'll be more interested in the P/L, P/L Per Trade, PCR% and Max Drawdown.
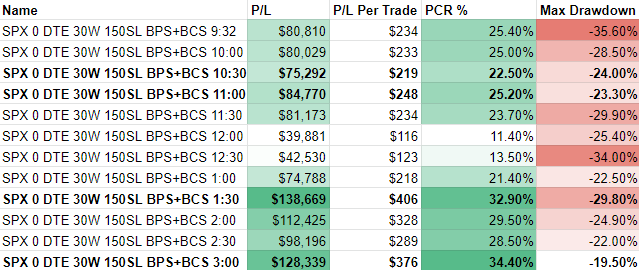
There's quite a lot to take away from the combine data. We see very nice consistent numbers from 9:32 to 11:30. All resulting in the similar number range. Specifically having 10:30-11:00 being the lower combine drawdown.
The 1:30 remains the highest performing but note that it's almost 90+% from the BPS side. So this timing can be inconsistent.
The 3:00 timing also shows very good combine numbers despite being so late into the start of power hour. Personally I'll most likely avoid this timing mainly because of my time zone, it's 3am for me. Unless I can finish working on developing my own bot to auto trade and handle the trade for me. Something I have in mind to work on but lazy to start.
From here I realise simply adding the 2 numbers together might not be the best reference data. So I pick few tranches and run them with the OptionOmega portfolio mode, means I can combine a few runs.
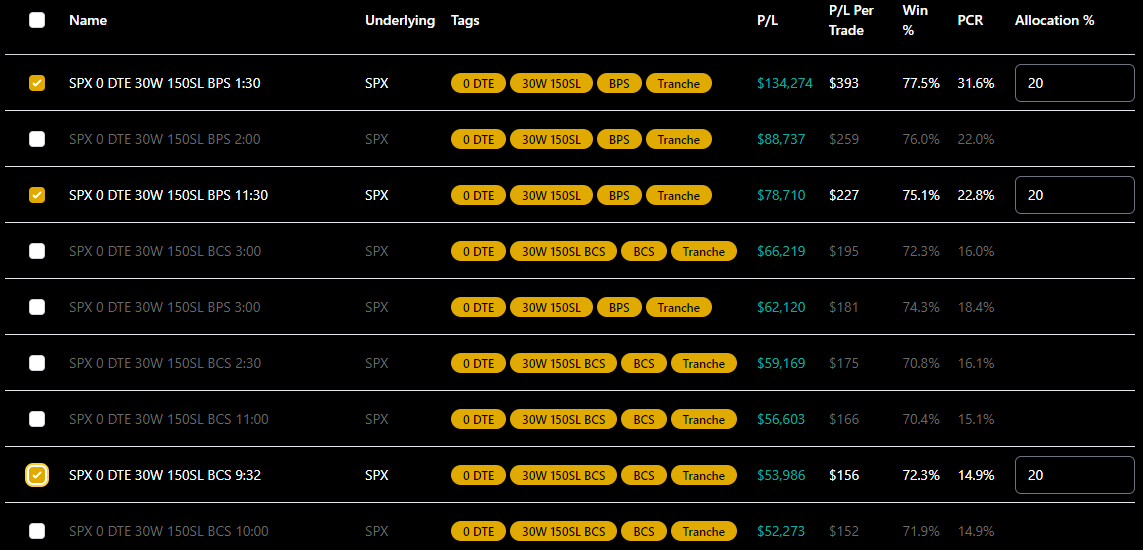
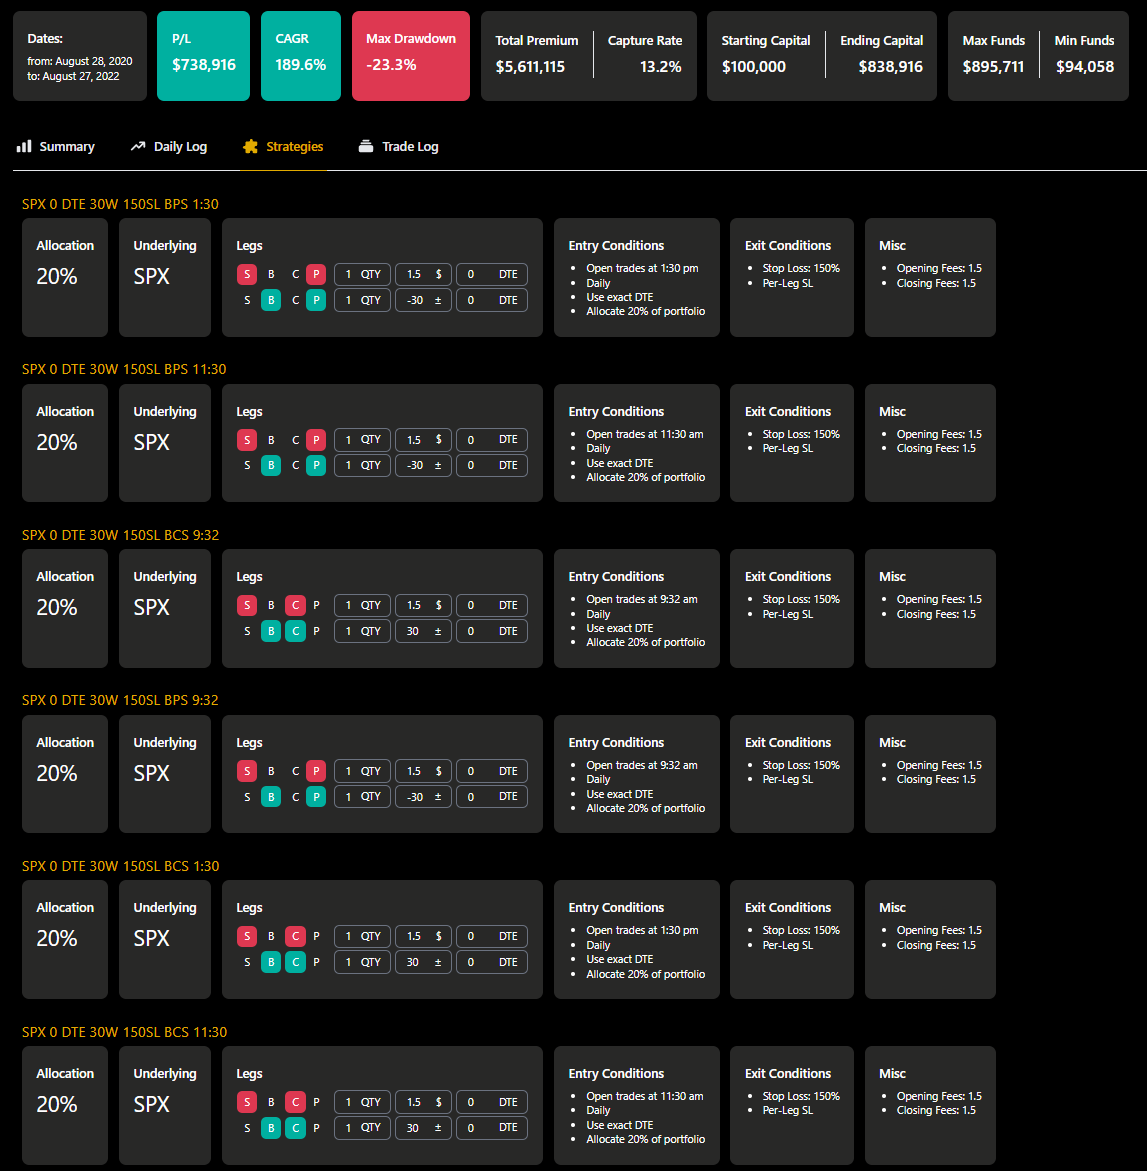
So I choose the 3 timing 9:32 / 11:30 / 1:30 for both BCS BPS and run it.
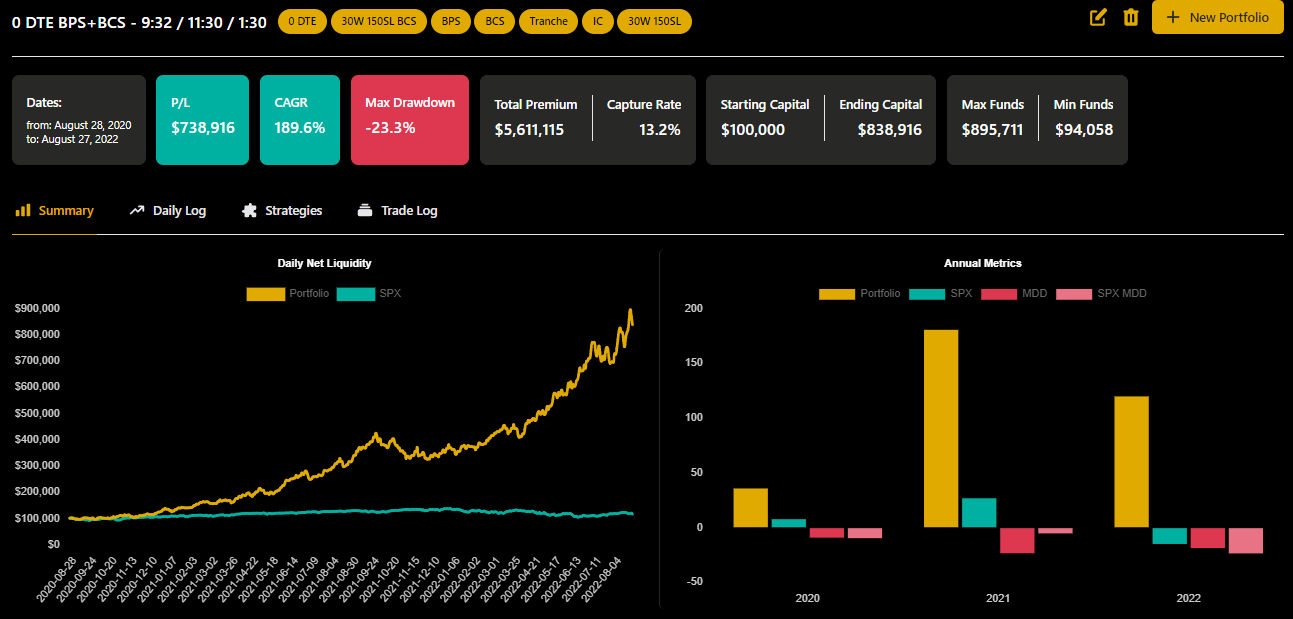
Well the numbers are pretty crazy here. I think the picture is self explanatory. I'll just run a few more other combination for comparison sake.
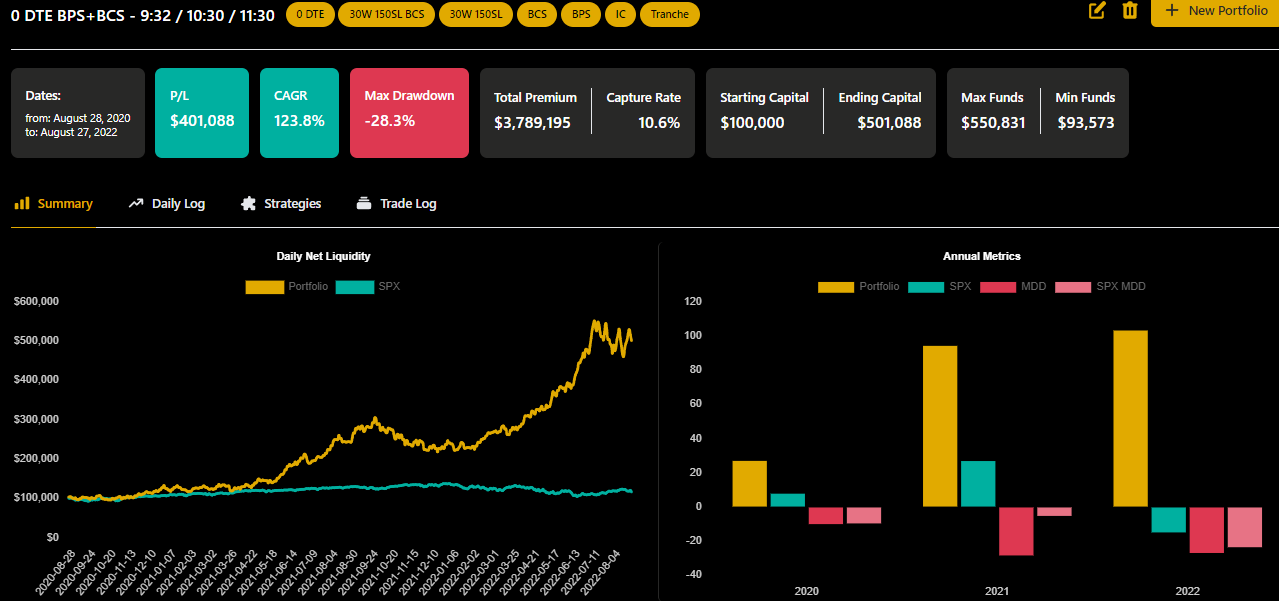
This is pretty decent still. If you want to keep your trading hours shorter, this might be what you need. 123.8% CAGR is still pretty impressive.
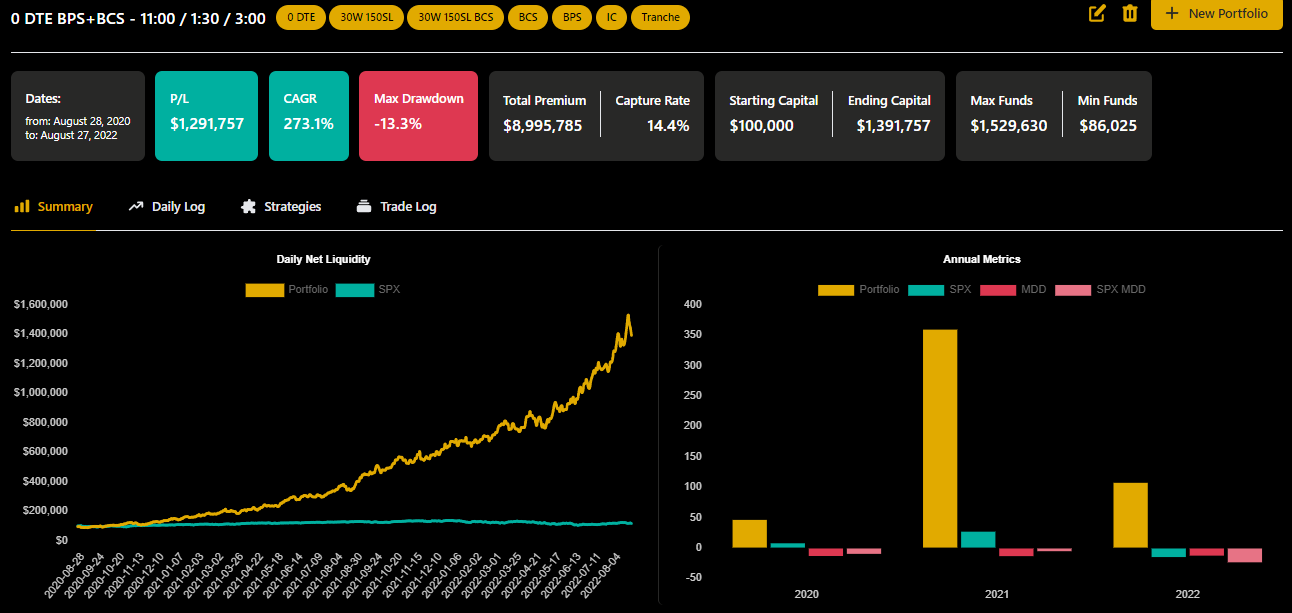
This 11:00 / 1:30 / 3:00 is selected based on the excel combined data above. Look how beautiful the curve is. With the sick 273.1% CAGR and only 13.3% max drawdown. This result is like the dream state.
From $100,000, scaling to $1,291,757 in 2 years.
Before we get too excited, this is backtest, it doesn't mean that we'll be a millionaire in 2 years. It only means based on historical data, we can take an optimal reference to guide our trade moving forward and hope it remains consistent.
It's a lot of things put together above, I guess I didn't organise things neat enough but well I think I kind of get what I want from this whole bunch of backtest.
The very important take away from doing all these backtest is to be aware that if we stay discipline in one strategy that has shown strong consistency and performance in backtest, it will eventually work out. Maybe not to the exact performance as we know reality has other factors involved. Even if I can get half of that kinda numbers I think I'm pretty satisfied. So the keyword - DISCIPLINE.
Note that every single row you see in the data is a separate backtest run. For each timing, each tweak is a different run. In total I think I ran more than 100 different combination. Some I didn't even track them. Hope the many hours I spent here putting together all these would help anyone also trading 0 DTE.
Gonna insert this snippet once again.


Member discussion