0 DTE Credit Spread Backtest - Stoploss Study

If you don't already know, I've been doing several related backtest on this topic. You can find previous ones in the Backtest section if anything here might appear confusing.
After my recent post on the width vs stoploss, it inspired me to find out even more on stoploss variation. And I realised I haven't actually done one. All along I've been believing other peoples data and anchoring on 150% SL. So I decided to run a whole bunch of SL variation myself.
I find this is very important because everyone does backtest differently, with a different agenda in mind, a different perspective, a different objective. The backtest results that others captured might be only a single perspective due to a different reason. So being able to run my own backtest on OptionOmega is really very important and powerful.
It's also the same to whoever is reading this post. The way I run it might not 100% be the things you're interested in seeing. So taking reference might add some value but running it yourself really multiplies that value to your own trading knowledge.
First Baseline Backtest Run
Just want to set as many constant as I can so you can follow me along to see some pattern.
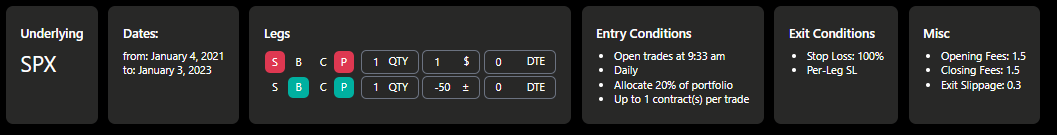
- 2 years from 2021-2022
- $1 short leg
- 50 wide
- 9:33 am entry
- Stoploss on Short Leg
- $1.5 Fees
- 0.3 Exit Slippage
So I'll run these on both Put and Call sides on 100%, 125%, 150%, 175%, 200%, 225%, 250%, 275%, 300% Stoploss. Yes 9 runs for each side per set, 18 runs just for this screenshot below with much more to come later.
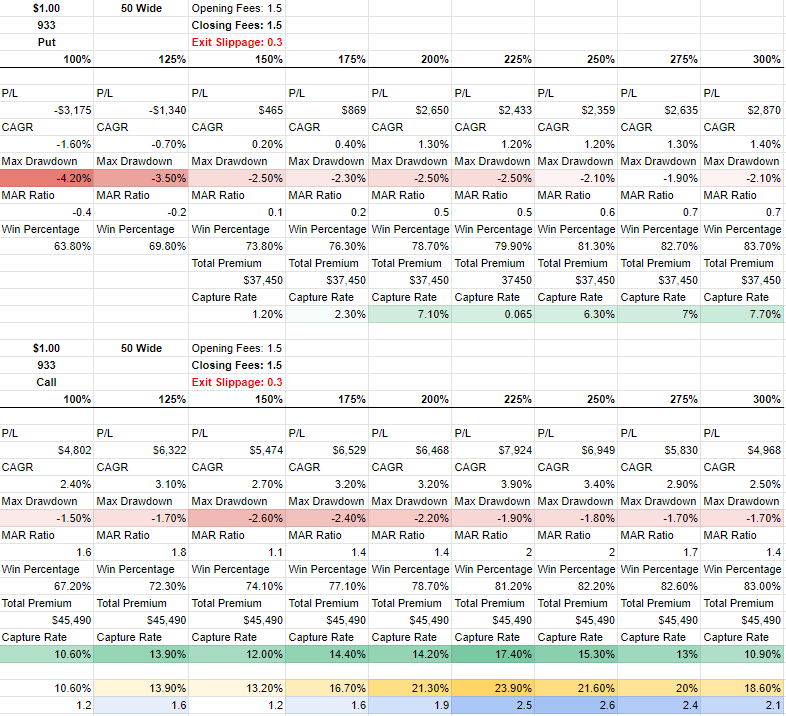
Drawdown
Initially I wanted to see if there's any impact on drawdown on different stoploss levels. Interestingly, there's significantly higher drawdown on the lower stoploss levels for Put side but it's more even on Call side. The skew in put/call difference seems quite interesting here.
Premium Capture Rate (PCR)
Similar pattern from drawdown, we can see higher stoploss levels actually get better PCR on the put side as well. While Call side's showing despite higher drawdown, it also has higher PCR around 200-225% stoploss.
The yellow weighted cells are combined PCR (Put+Call). Since we run both sides, to find the optimal I'll add the 2 together to see where is the highest combined PCR.
MAR
Mentioned in my previous post, this is basically CAGR/Drawdown. Kind of a simplistic performance ratio.
The one in blue weighted is the combined MAR of both Put/Call. It also seems to weigh better towards 225-250% stoploss levels.
Slippage
Note that the slippage I used here is 0.3 on exit because this is the average of what I get in my real trades. But while running, new questions popped in my mind.
What if other stoploss levels have a different slippage values?
Ok, so to answer that I ran the exact same thing, with 0.1 slippage. Just to see how does slippage affects the results. Not to directly answer that question above.
From the above baseline, you understand how each set looks like. So I'll not explain again.
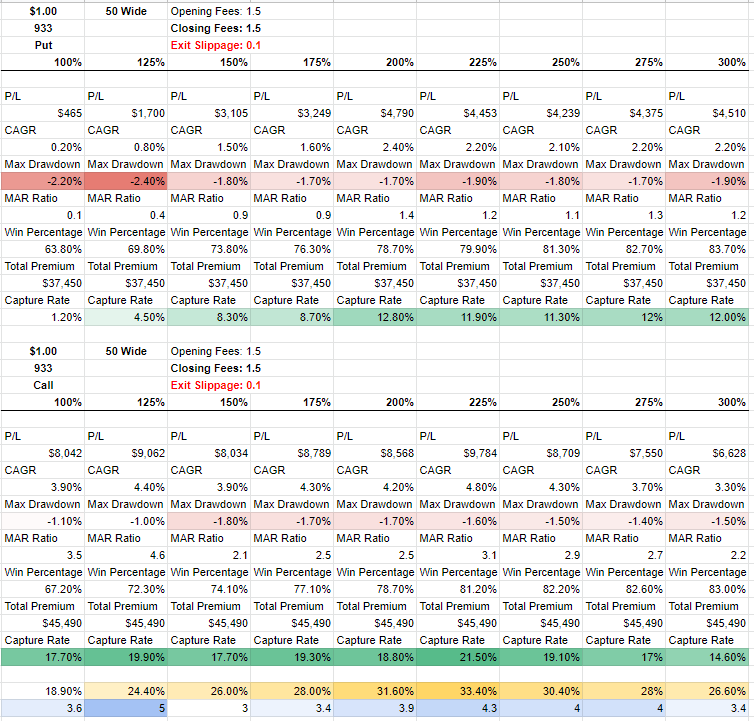
If you compare the 2, you'll realise the drawdown gets more obvious when slippage is higher. Means slippage is causing more of a drag to the trade. This leads to even more questions that I cannot run every possible variation so let's tackle the few I have upcoming.
Next question I have is:
Instead of $1 short leg, will $1.5 short leg make a difference?
The reason for this question is because having a different short leg credit target means all the stoploss multiplier values changes, basically larger. Which means slippage might not affect them as much?
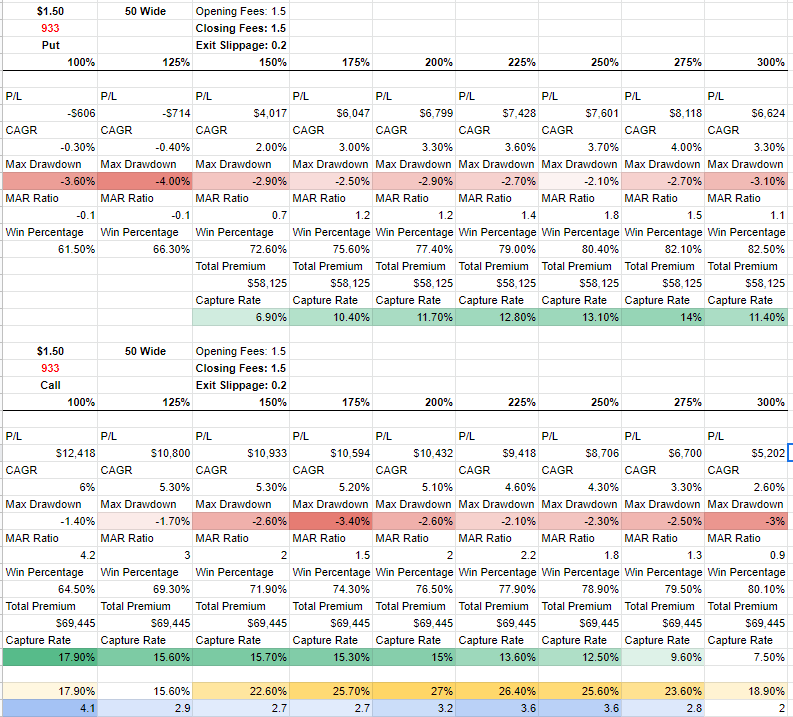
Also note that from here I fixed the slippage to 0.2, to have a more balance fix slippage across. Overall we still see a similar pattern from previous but much more volatile, bigger drawdown numbers. Probably due to higher credit means we're getting 1 strike nearer in a big portion of the trades.
But the better performing combined stats still sits around 200-250%. (Yellow+Blue)
Next question:
Will a different timing have the same pattern?
Timing
So I picked one of the better performing timing I've seen so far, 15:15. The rest remains unchanged.
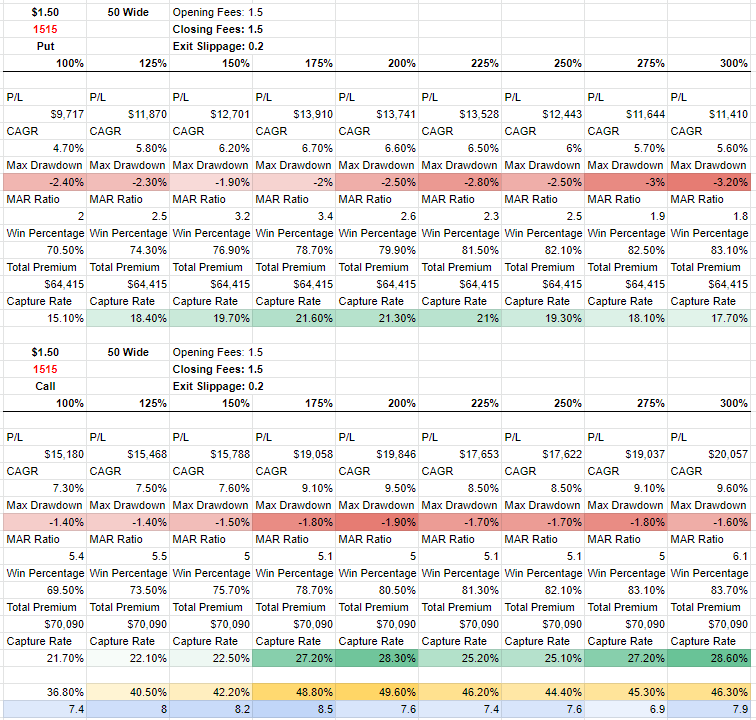
Wow! Very interesting different pattern we're getting here that's leading to a lot of data points when we compare the results. It seems that 933 doesn't like lower stoploss but 1515 don't mind. In fact with a slightly opposite skew that higher stoploss actually has a slightly higher drawdown. Once again, Call side seems pretty tough where it stays quite consistent regardless.
Best combined performance here seems to stay around 175-200% stoploss and maybe 300%.
At this point, you'll realise the backtest pattern can vary quite a lot with small little change in configuration. Different timing, different stoploss, different credit, different slippage, or anything that I didn't tried, might skew the results. So running your own test is really important.
But so far, what I'm getting out of this is although different timing has different results, the better combined performance hovers around 200% stoploss.
So I ran one more variant, this time only changing the credit to $1.20. Still on 1515.
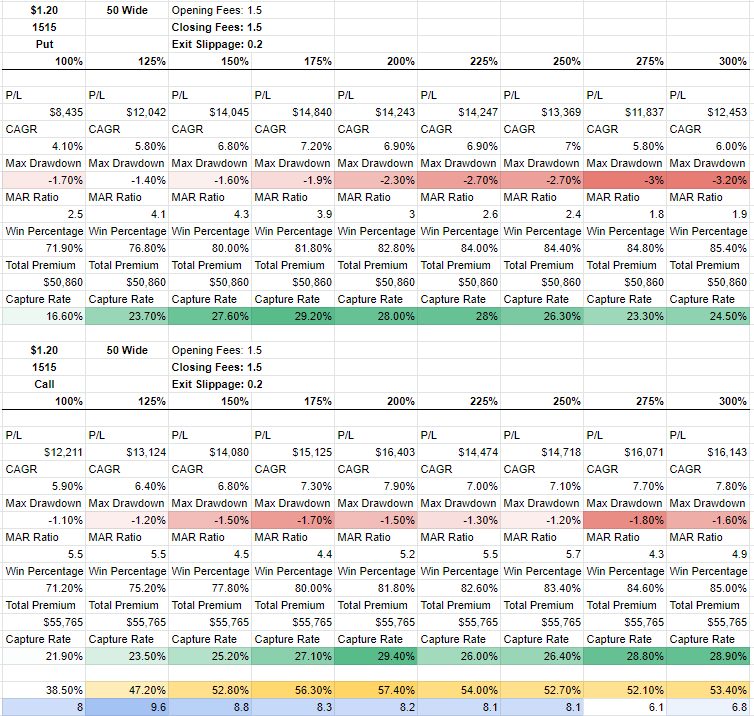
Interesting, as we go lower credit, which result in further strikes on average, the Put drawdown becomes obvious towards the higher stoploss. Once again call side drawdown remains pretty tight.
BUT, we still get the best combined performance around 150-200% stoploss.
Conclusion
See despite running so many runs I only can sift out some difference in pattern. There's so much more that can be done. Maybe every other timing could have a different result? Or credit target? or Width? or even Fees?
Personally I feel the heavier impact comes from timing and credit target. At least for the pattern I'm trying to find. To me it's not about finding the perfect timing, it's more of to find the most reliable stoploss % to use that can get consistent performance regardless of timing and credit. From the above, I think I kind of get my answer. At least for this series of runs, I'll be taking the 200% one.
There's really a lot more possibilities and data points to figure out. One that I have in mind is actually running from May 2022 onwards because that's when we get daily 0 DTE. Which means changing the timeframe itself from 2yrs to 7mths we might see a different pattern again.
Join me in the backtesting journey.
Catch me on Speaking Greek Discord (Vocs Ong#6331).


Member discussion