0 DTE Put/Call Spread - Width x Stoploss Backtest Comparison

I actually was just randomly doing OO backtest on few topics around timing, width and stoploss. Until I realise I cannot visualise it well enough if I don't capture the data down for proper comparison. So I started to capture each of my runs and since I copied and organised them, might as well journal it for sharing and more discussion.
Backtest Setup
So this backtest is mainly comparing the MAR ratio (measurement of returns adjusted for risk) and Premium Capture Rate (PCR) when Spread Width and Stoploss changes. Means the main changing factor is Spread Width and Stoploss, the rest remains unchanged.
Fixed
- Date to Expiry = 0 DTE
- Short Leg Credit Target = $0.8
- Entry Timing = 3:15PM
- Fees = $1.5 per contract (this is my estimated average fees on IBKR)
- Slippage = $0.32 per exit (this is actually my actual average slippage past 3 months)
- Date = Last 3 months (29 Sept - 27 Dec 2022)
- Portfolio Allocation = 20% (this means it will scale as it profits, it is intended to see the benefits of the spread width differences)
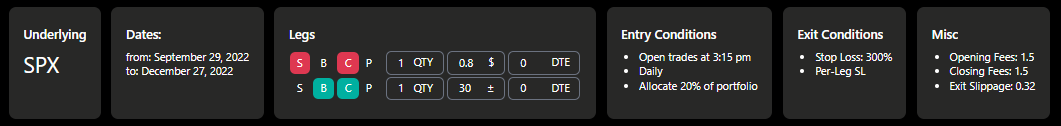
With the above setup, I ran the combination of:
- Spread Width = 20/25/30/40/50
- Stoploss = 150%/200%/250%/300%
It's a pretty short term last 3 months run, not trying to make any huge conclusion from here. Just trying to see if there's some potential pattern with the numbers from all these runs. At this point, you'll probably not know what to expect. I'm the same before I started, until you see data being put together then you realise there's always something to take away. Somehow that's the fun part about backtesting and data analytics.
Backtest Results
Let me throw you with the raw copied results from each backtest, starting with Put then Call.
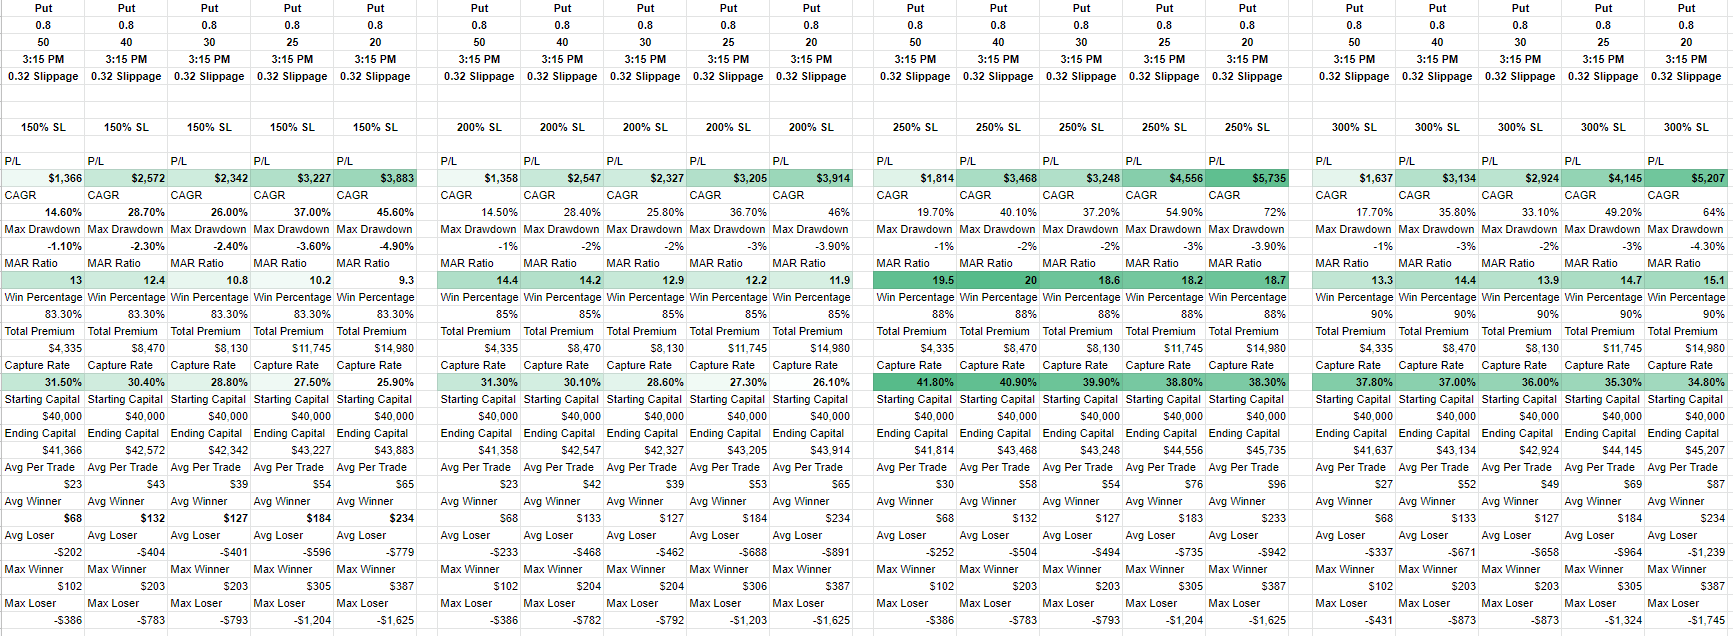
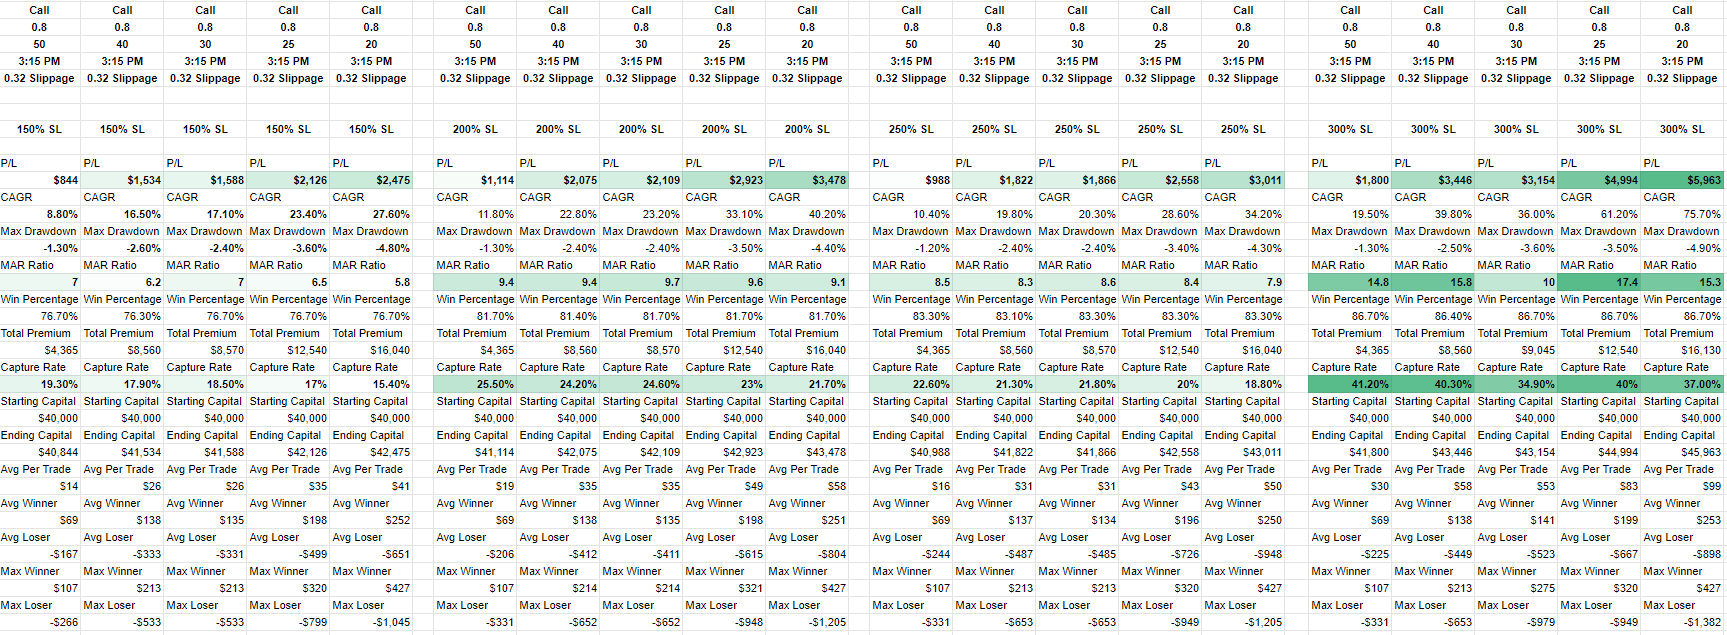
Yea I know it's alot of numbers, just throwing the entire thing here for full reference. For this I'll only be interested in MAR and Capture Rate. Why? I just find these 2 factors shows the pattern I wanna look at for this setup.
After seeing the MAR and PCR, somehow I think it's not easy to put into 1 chart for visualisation. So I multiplied them together into some combined value, basically is simple MAR x PCR. Not sure if that means anything, here's how it looks like.
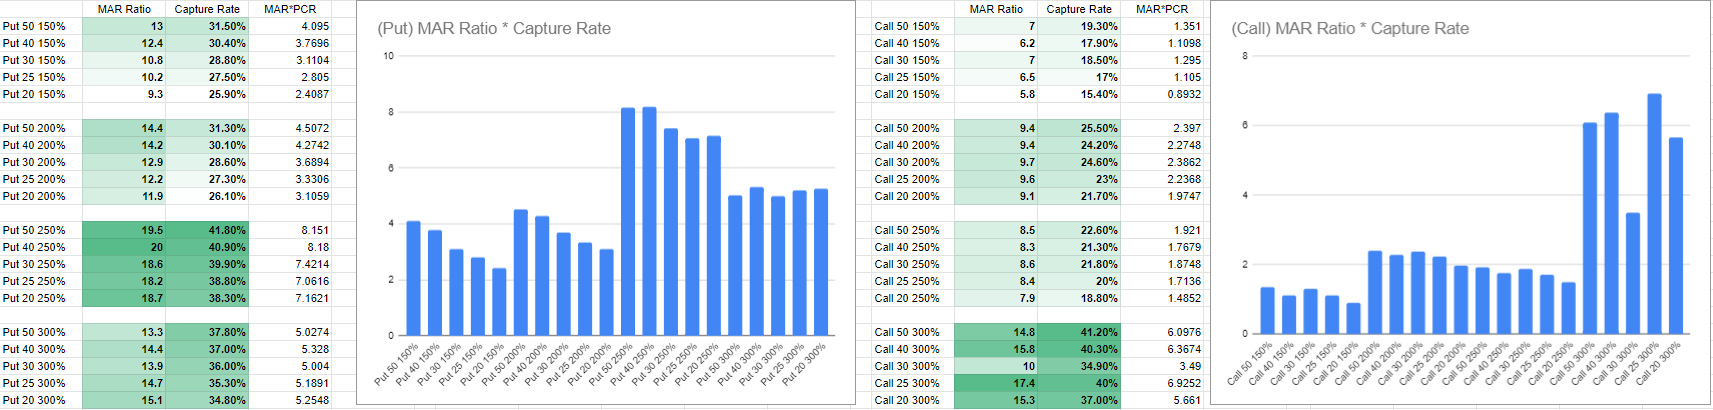
Conclusion
Within this short 3 month OO backtest run, we can see some recent pattern.
- 250% Stoploss on Puts performs the best while 300% Stoploss on Calls perform the best.
- The wider the spread, the higher the PCR but the lower the leverage.
So for Stoploss, maybe try 275% for both to get the best of both worlds?
And for Spread Width, if you want more consistency, go wider. If you want more leverage, go narrower. It's a balancing game between consistency and leverage. Another way to put it is, imagine your asset growing in a gentle slope vs a roller coaster slope.
From all those numbers above, there might be other takeaways that is not in my perspective. If you see any, do feel free to discuss either leave a comment here or find me on discord. Currently, I'm active on Speaking Greeks and Trade Busters.
Again and again, just reminding that backtest doesn't always represent the future. It's for reference to identify potential pattern that gives you conviction that there's a possibility that in future the pattern might continue.
Bonus Mention
The 3:15PM timing is inspired by @Amy.


Member discussion