10 Apr 2022 SPX Weekly - Dip or Bear

Accuracy: 14/18 (77.77%)
SPX above 4450 - Correct
Last Week
SPX dipped right onto 4450 before closing at 4488 on Friday.
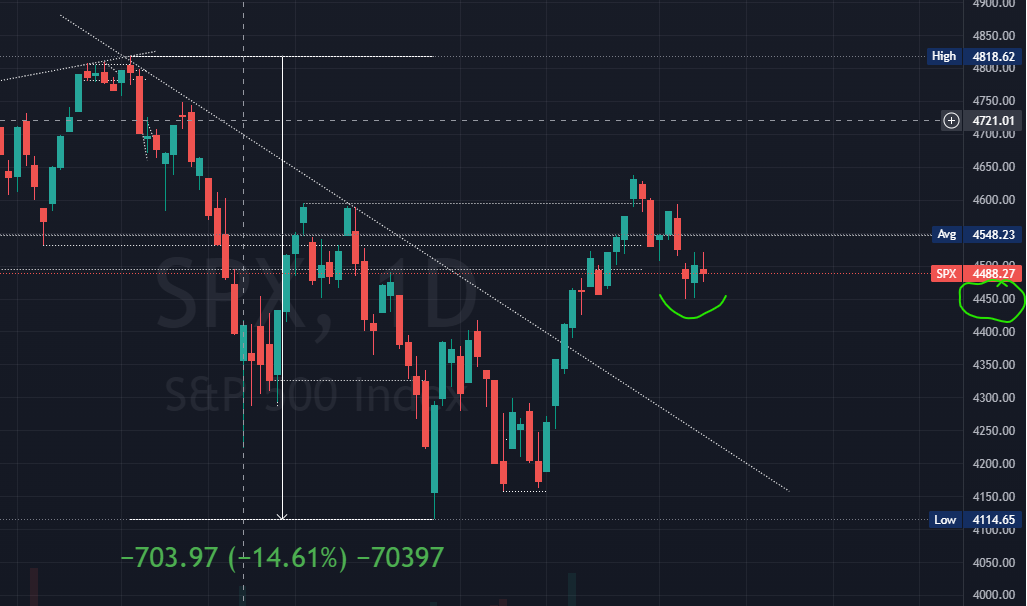
Pretty much played out like I guessed in last week's post. FOMC minutes and the multiple FOMC speeches scares the market out. Of course I also believe that's what the market makers tries to magnify to push down prices. The sentiments just seems bearish now.
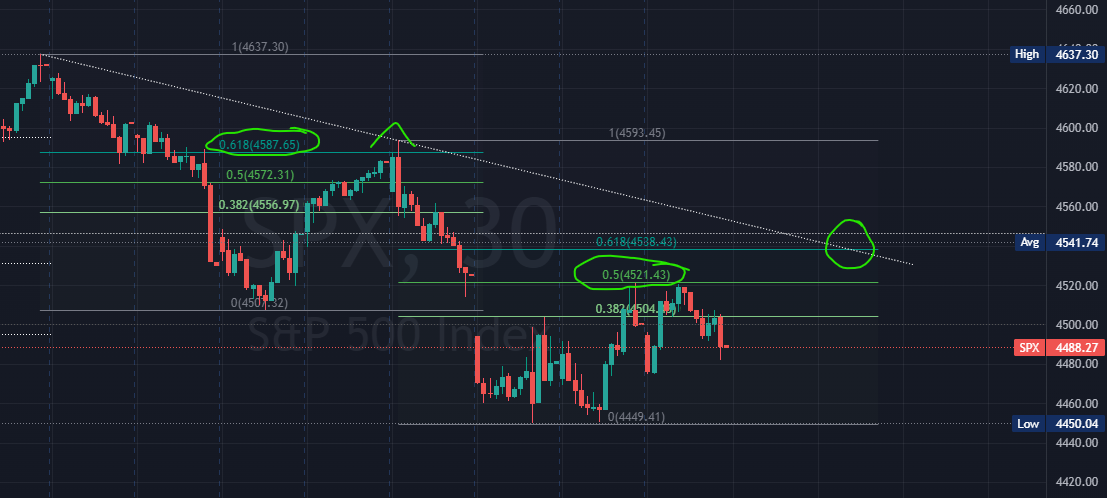
So there's something interesting that I've been noticing - Fib levels. Recently the Fibonacci levels are getting very well respected so I thought I want to highlight it.
Look at the 30 minute chart which shows a short term downtrend, the first push up rejected off the 61.8% fib levels. Friday we touched the 50% fib level. Drawing a downtrend line there actually kinda suggest it will meet at the 61.8% fib level once again.
But just from last week analysis perspective, we remain a longer term uptrend with this short term downtrend in play. Lets take a look at what could happen in the upcoming week.
Upcoming Week
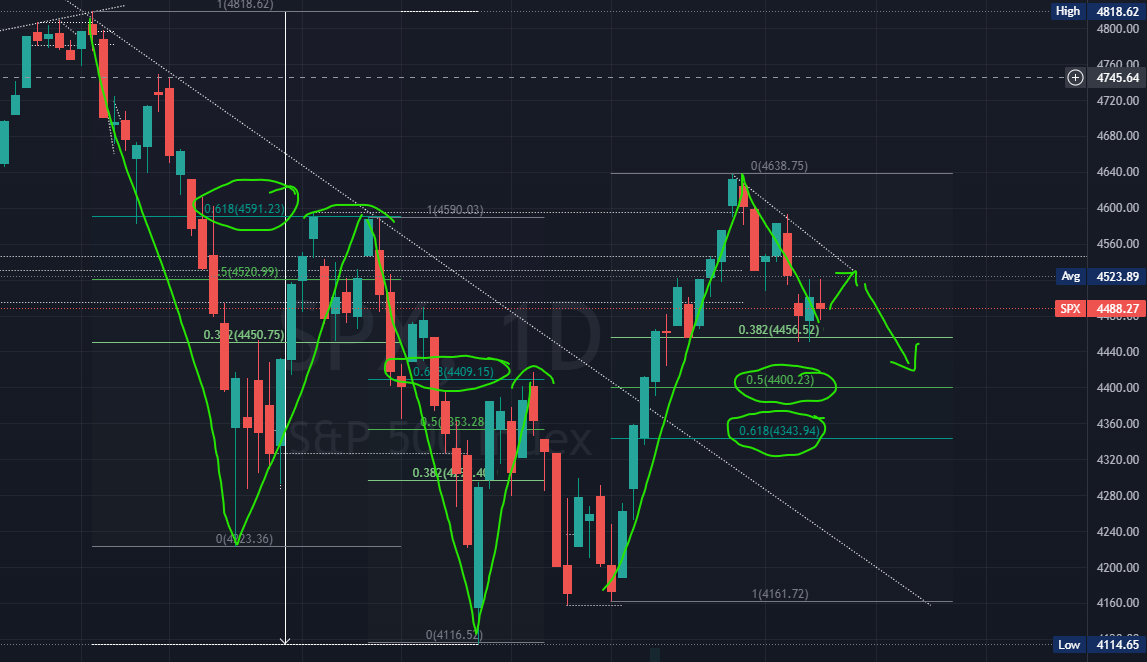
Just want to continue to show how the fib levels have been playing out since January. Look at the past few correction, it ran up almost exactly to 61.8% to find resistance. Now that it has broke upwards, we might potentially see a 50%/61.8% fibonacci support level.
Just to also throw in a bonus perspective. Below is the weekly candle chart.
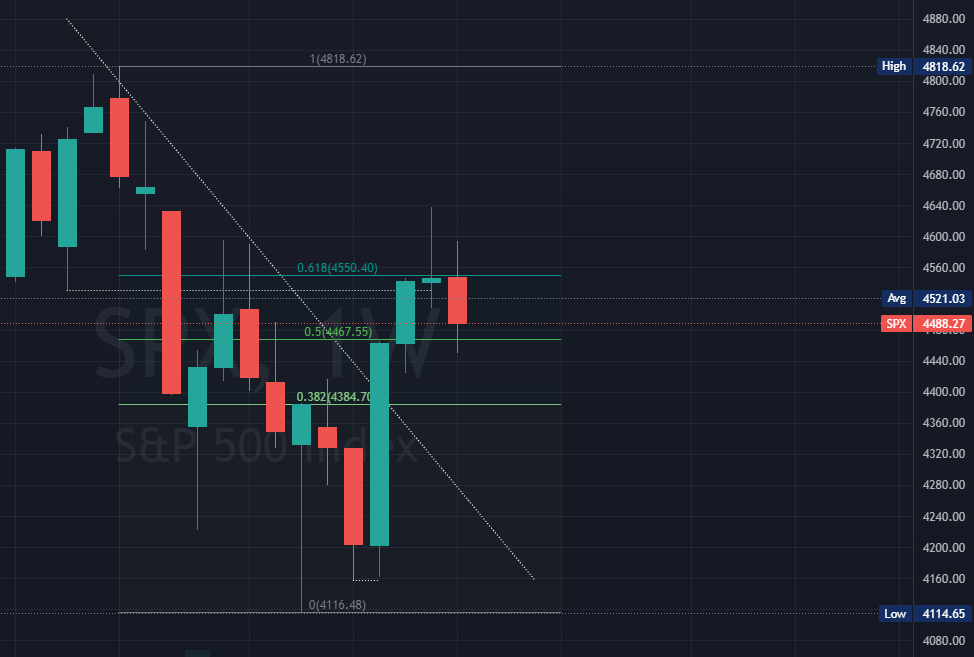
Look at how it also rejected off the 61.8% level even in the higher time frame.
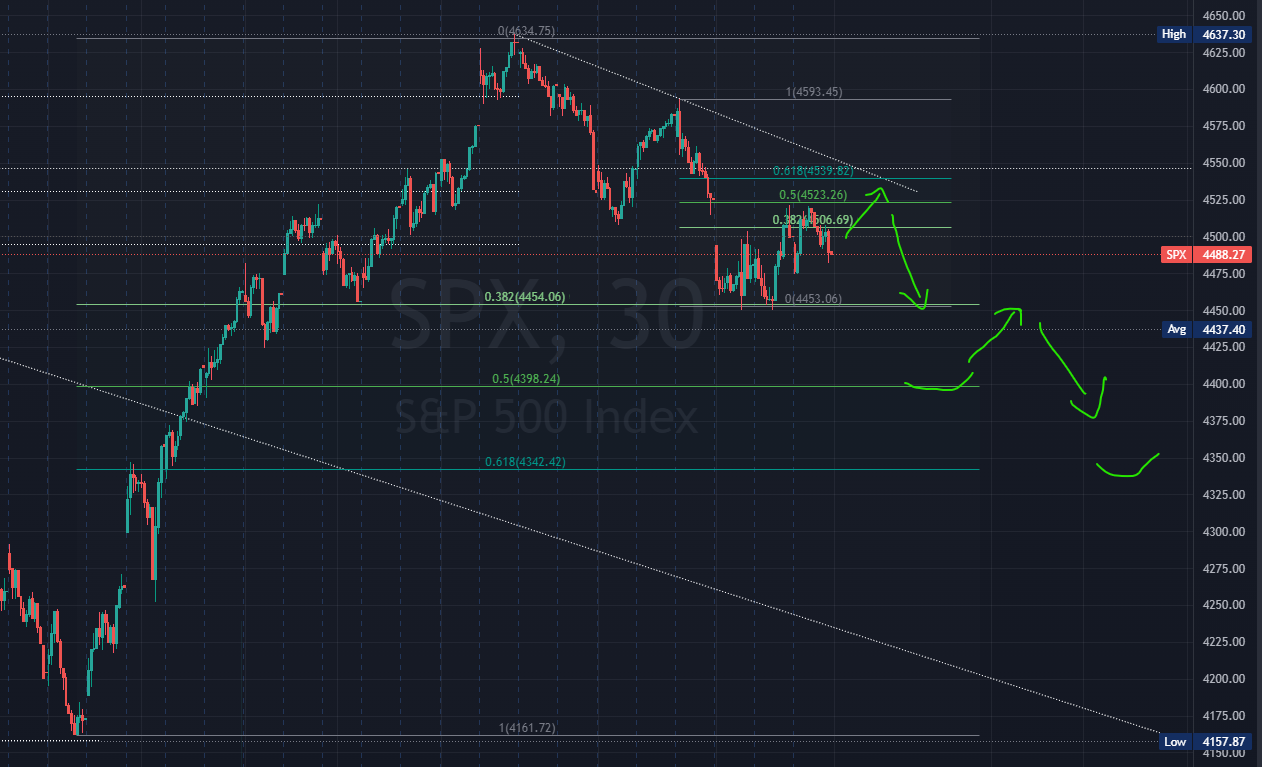
Putting it together using the 30 minute chart, it does seems this short term downtrend has some more runway downwards potentially towards 4343 area.
From a 1 week ahead prediction perspective, it seems to suggest higher probability to stick with the short term downtrend.
Economic Calendar
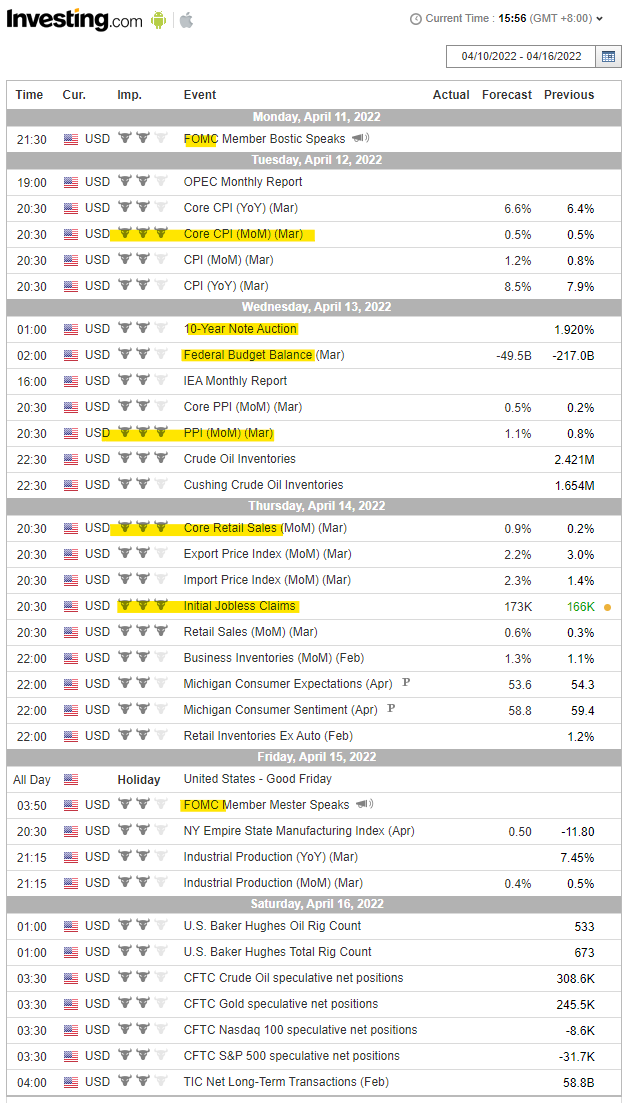
Next week seems to be another happening week with CPI, PPI, Jobless Claims, Federal Budget Balance and some FOMC member speaking again. All these magnifies and reminds people about the inflation and recession once again.
At least to me it seems more red days next week which pretty much aligns with the technical charting.
Earnings
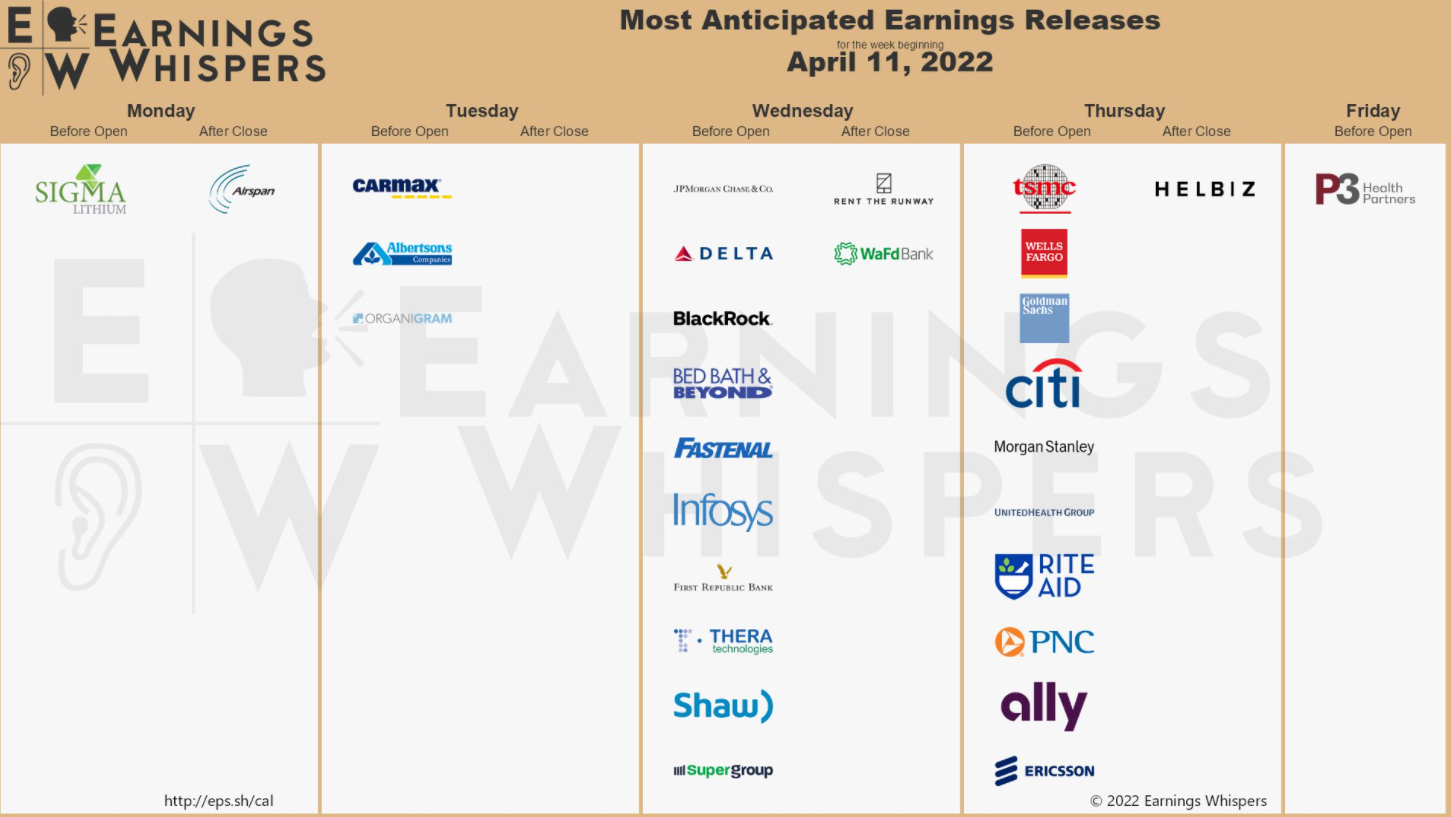
Not much but it's getting started. Next week we are having few major banks and financial sector earnings release. And one mega cap TSM on Thursday.
Although I kinda lean bearish on the above analysis, these earnings might not swing the market but we might see some sector rotation.
What I'll guess is money will continue to rotate away from tech sector, which potentially flow into the finance sector if their earnings announce good stuffs that attracts money. Otherwise, defensive sector will be the default go to.
Prediction
With the short term bearish lean, I'll go alittle more aggressive at the fib 61.8% level as resistance.
SPX below 4550


Member discussion