19 Jun 2022 SPX Weekly - Spiral Down

Accuracy: 21/26 (80.77%)
SPX Below 4080 - Correct
Last Week
Pretty expected that market continues going lower right after inflation data showing it's not going lower and Feds deciding on increasing the rate of interest rates.
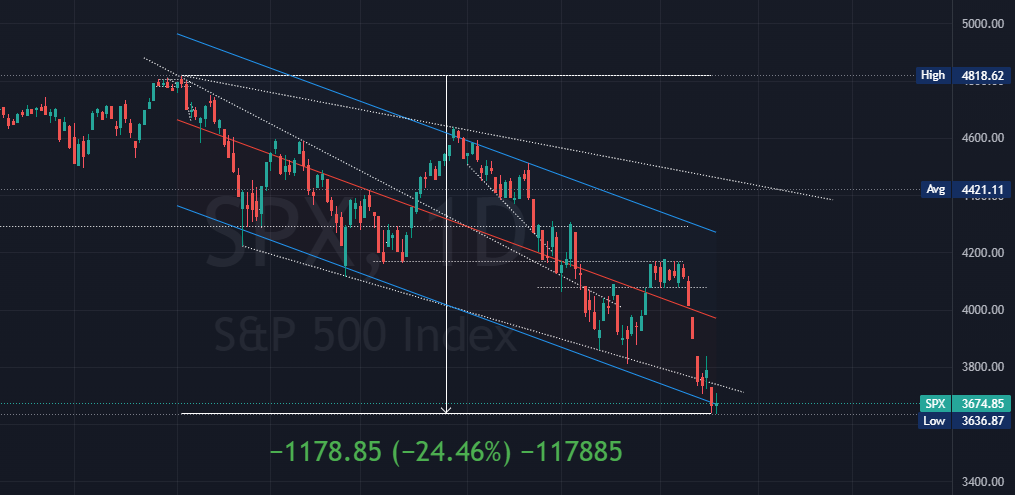
Lets start with the daily candle chart, we see year to date the very clear downtrend channel. Last week specifically, we grinded lower but at a slower pace. Probably due to hitting the bottom of the downtrend channel which kinda act as a resistance area.
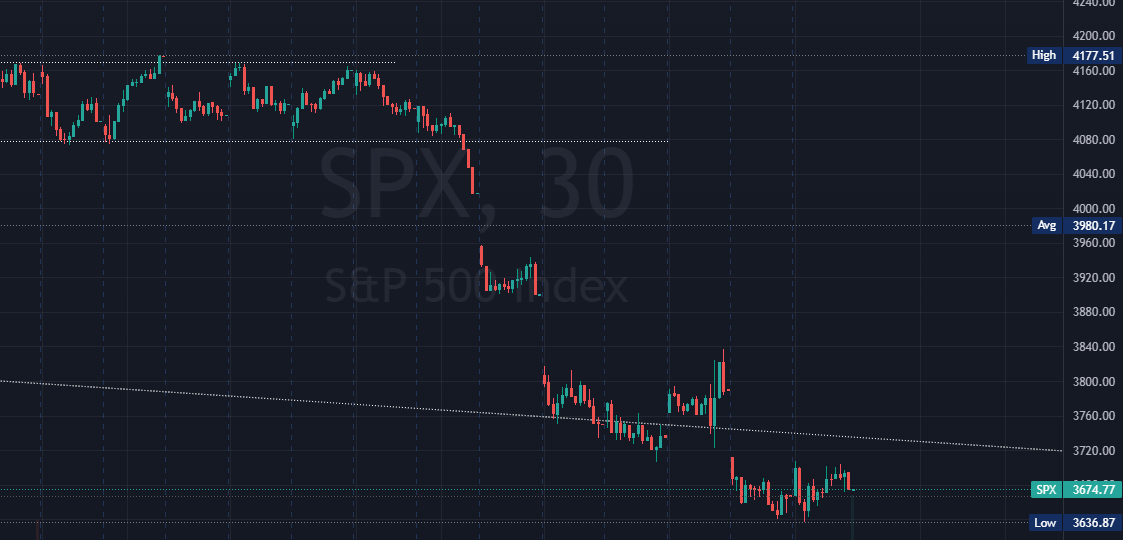
On the 30 minute chart, we see more obvious slow grind down week. Despite several economic events from Feds and FOMC, it seems the big move has already set in the week before when CPI data released.
Next Week
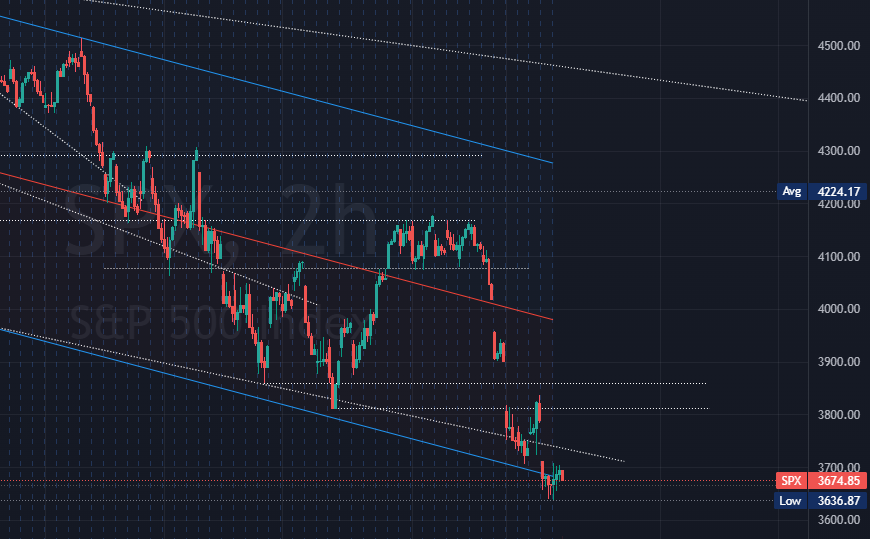
This is 2 hour candle chart, I usually don't use this but I stay flexible. I browse around different timeframe to look for better view time to time and sometimes we do see a slightly different perspective on other time frames.
On the 2 hour candle chart, following the last week slow down in down momentum, I do expect some consolidation in this area probably around 3600-3800.
Main trend to follow is still the downtrend, keep that trend your friend but down trend does has small pullback rallies or consolidation. So from technical perspective, we probably expect some kinda small pullback up before going lower.
Economic Calendar
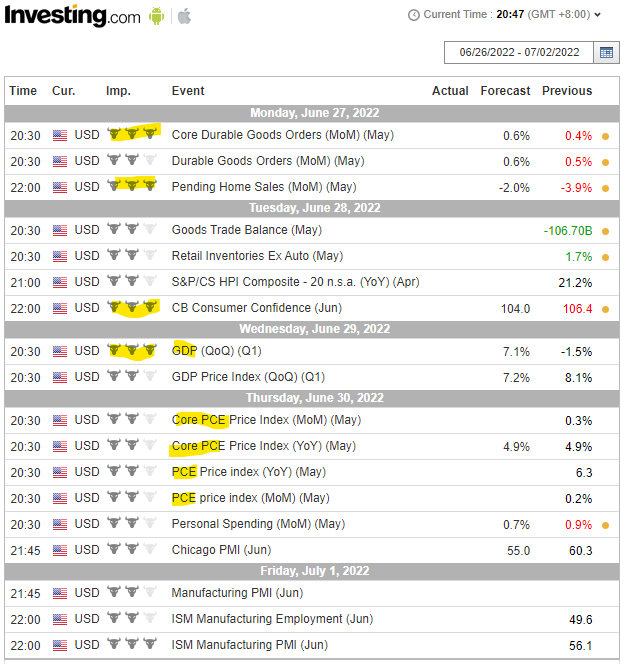
For next week's economic events, there's not much super impactful ones like those we had in the past 2 weeks. We do have a few that will probably continue to fuel the inflation topic which is already more or less expected.
So what's really critical is last week specifically, Fed is underestimating inflation and getting more hawkish on interest rates and quantitative tightening. This pretty much is the extending factor for the current downtrend. Which means we might not see bottom so soon as inflation has yet to find its peak.
Prediction
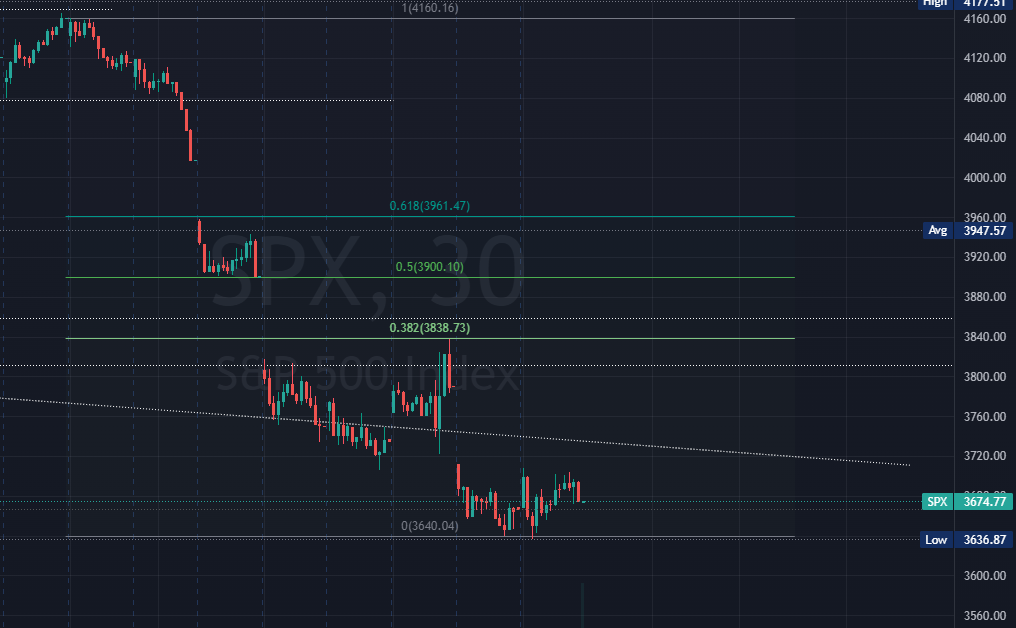
So its a little tricky to me because the main trend is down but I do expect some small bounce up in the next few days. With the Fib level drawn, upside resistance goes around 3900-3961. The tricky thing is putting prediction on downtrend but expecting it to go up which is against my prediction seems kinda weird. Which then lead to putting a further buffer to ensuring I'm right.
So for this week instead of going 250-300 points up side resistance prediction, I'd rather choose downside instead with 3500 as the key support area.
SPX above 3500


Member discussion