28 May 2023 SPX Weekly - Bull

Accuracy: 63/69 (91.30%)
SPX above 4100 - Correct!
Last Week
SPX had a strong rally closing Friday above 4200. I kinda think this is quite significant as we rejected 4200 before just last week.
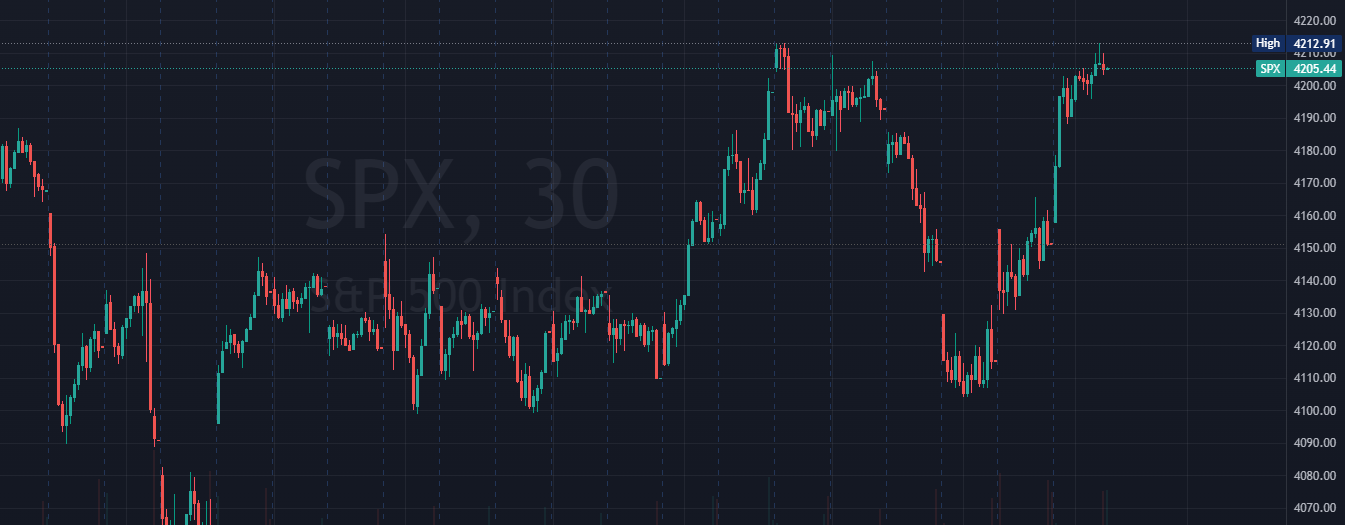
If I'm nto wrong, it's the first time we CLOSE above 4200. Last week, we had a gap up open above 4200 but we eventually close below 4200. The Friday bullish move is so strong we end the week above 4200.
Now we have to step back and look at the bigger timeframe to see what are we gonna expect.
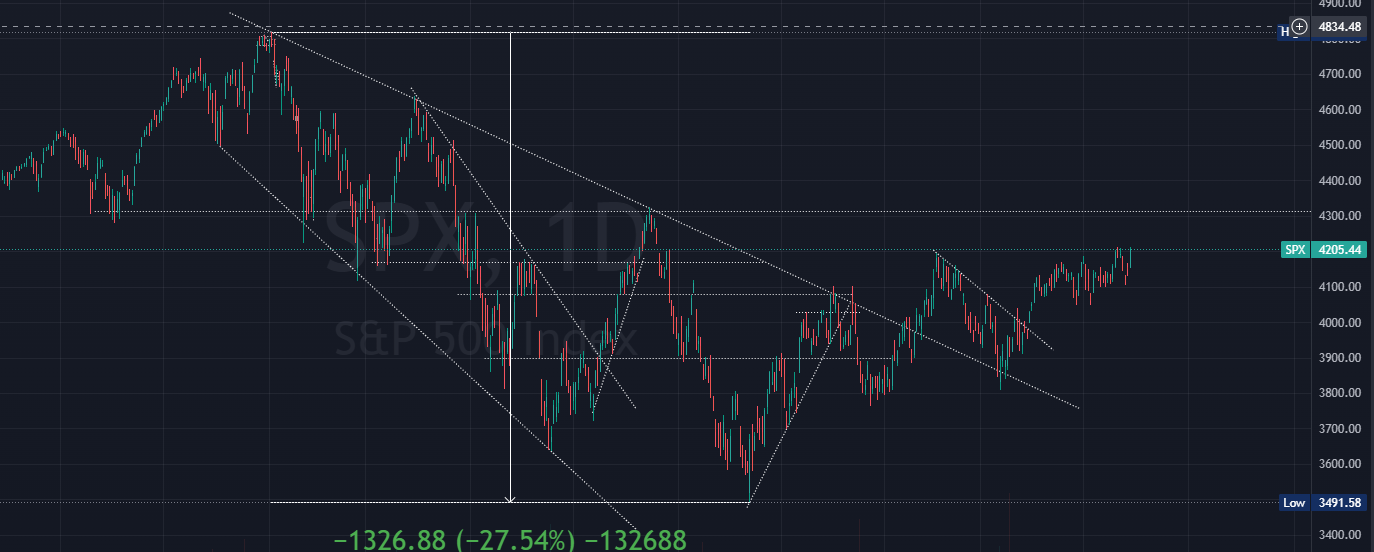
As mentioned for quite awhile, we're still in the higher low higher high uptrend. Looking at this 1 year perspective, the uptrend seems pretty valid still.
Economic Calendar
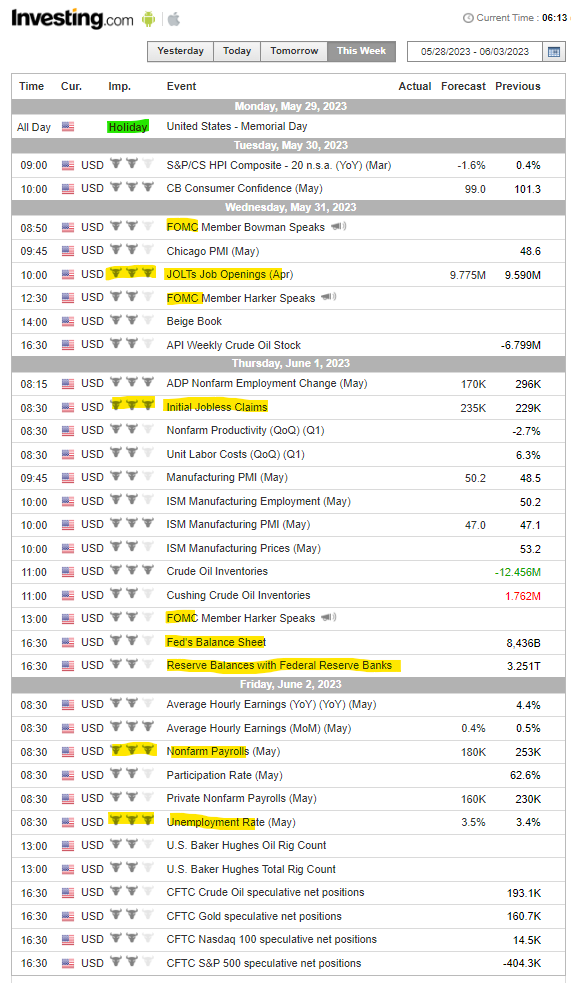
To be honest, next week seems pretty quiet and short since we having a Monday holiday. Those financial related activities and Fed speakers might cause some volatility but I think it's not gonna be enough to cause a change in momentum.
Earnings
Just to touch on this because last week I kinda missed it and this is kind of one of the reason of the rally. So to mentioned, NVDA had earnings and shot up 20+% after their earnings post market.
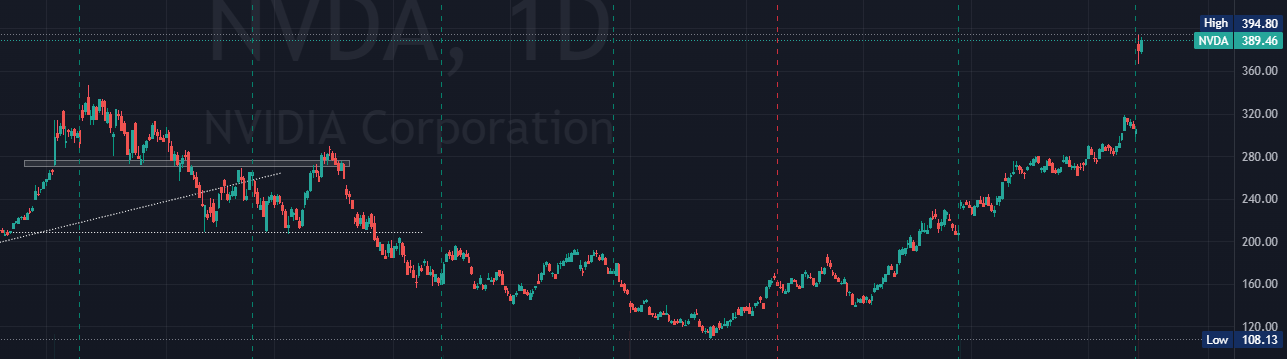
Just to catch a glimpse, NVDA is now at all time high after their earnings gap up. And the reason NVDA is able to move the market is because they're now the 6th largest market cap company.
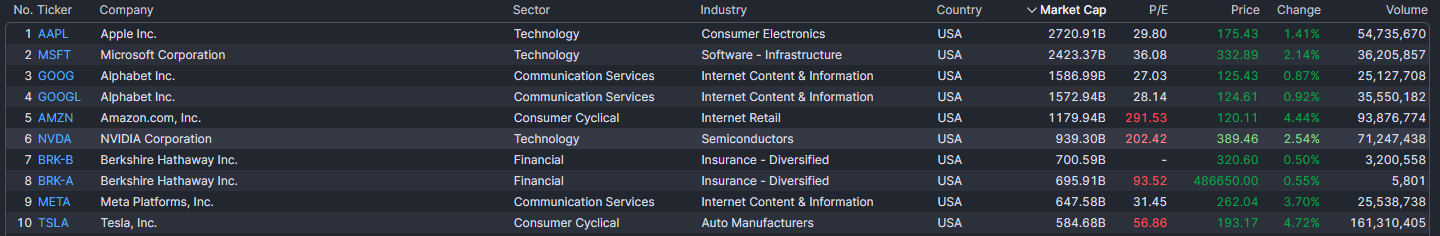
So to just have a quick look on next week's earnings.
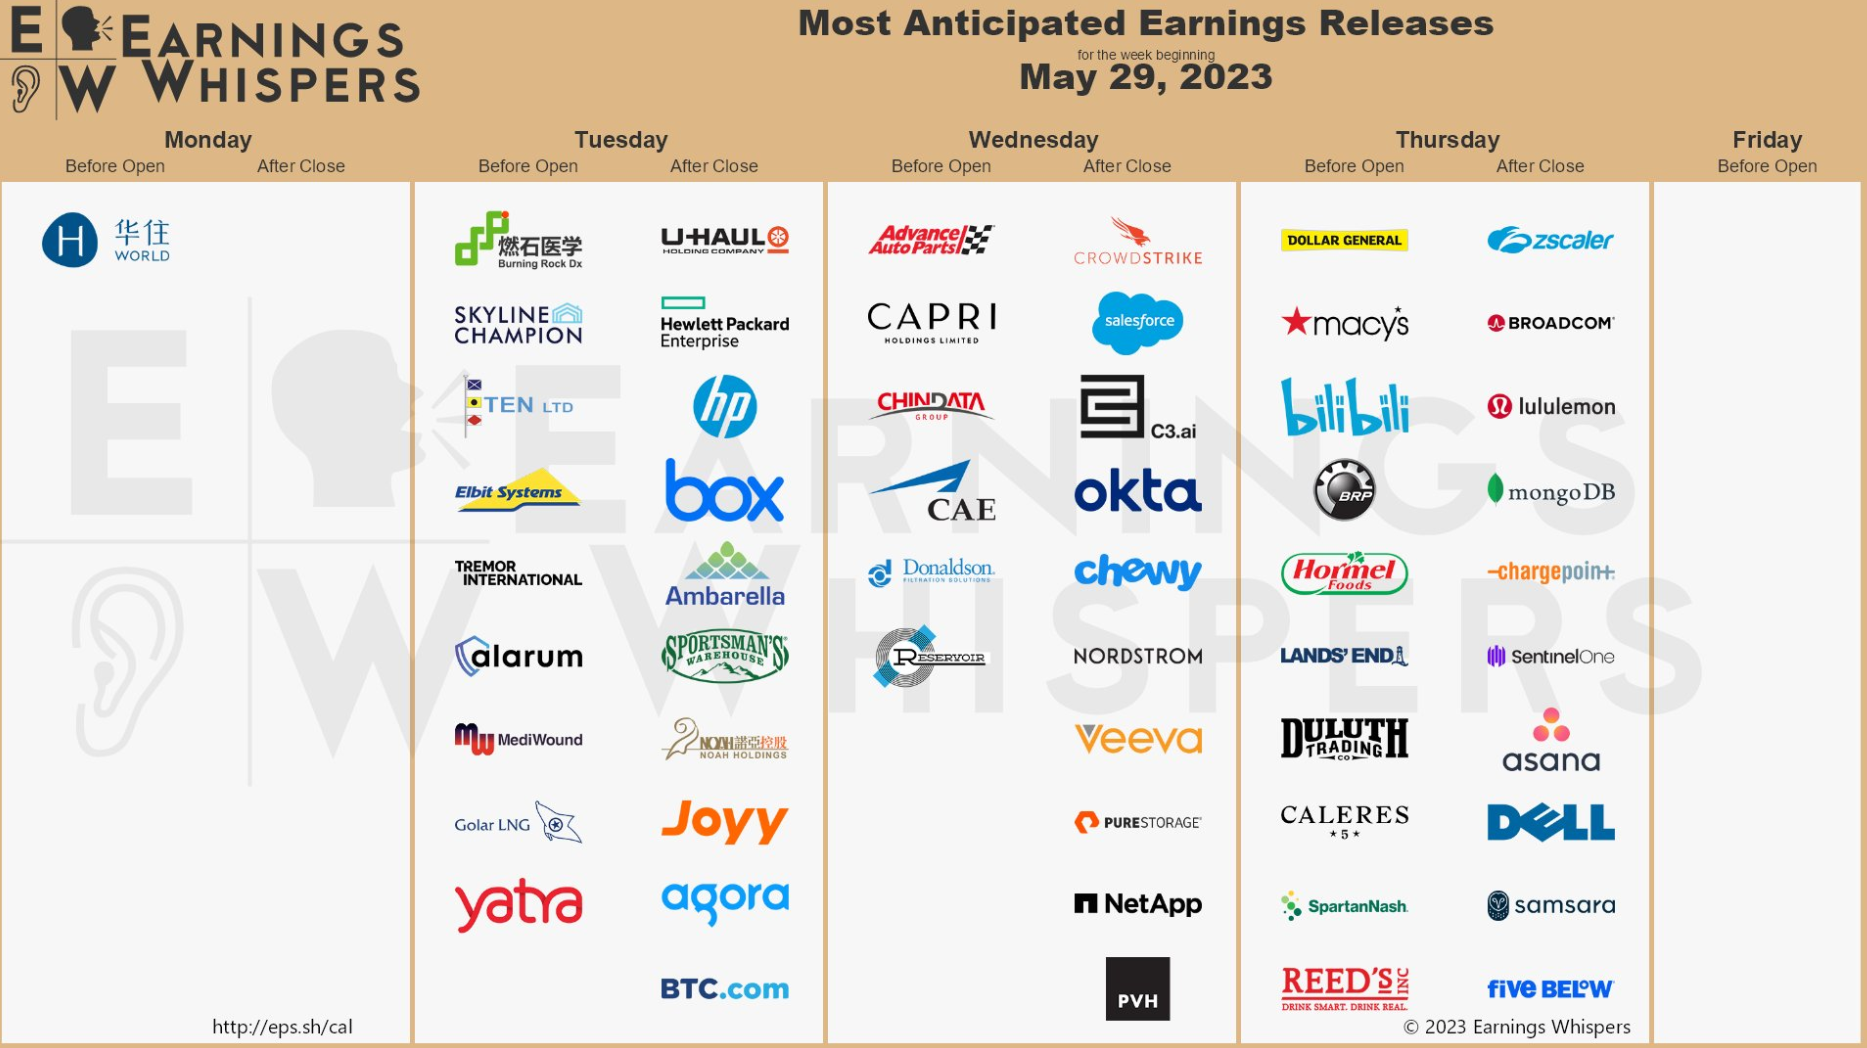
Nothing super catchy like the mega caps, maybe CRM (salesforce), M (Macy's), Broadcom (AVGO), Hewlett-Packard (HP), Dell (DELL) Mostly not significant to the market. Broadcom had its share of rally from the NVDA gap as it's in the related semiconductor industry. Overall, nothing much I feel unless there's surprises.
It's always good to check though.
Seasonality
Some time back I shared a seasonality chart from stockcharts.com, this time let's take a look at a different source.
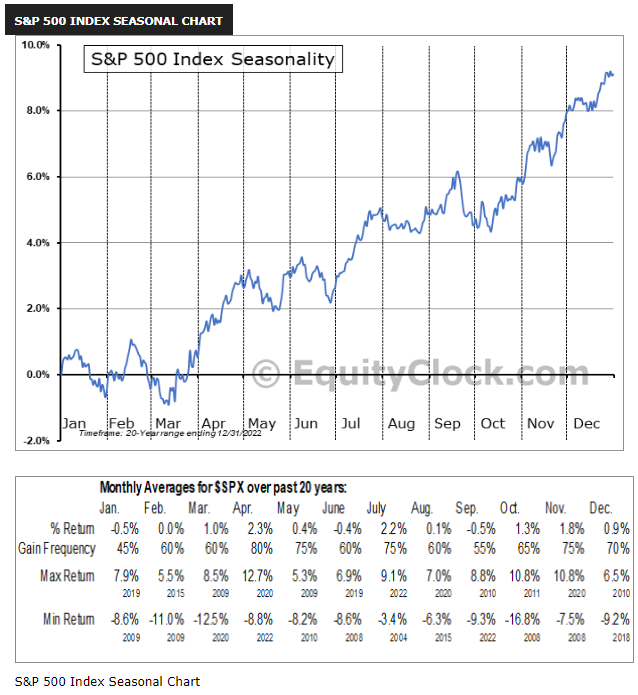
This seasonality chart is from equityclock.com. Before we read too much into it, let me throw in SPX chart for side by side.
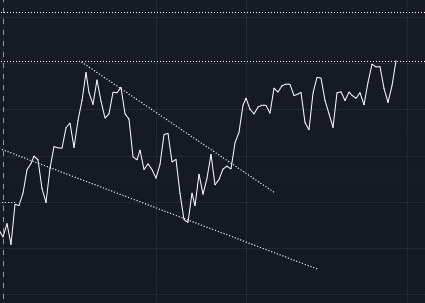
Made a line chart version for easier comparison. It's actually interesting to see such similarity here, especially the dip on March. What's interesting to note is after consolidating in May-June, we might expect a strong rally into July. Maybe that's something to look forward to.
Next Week
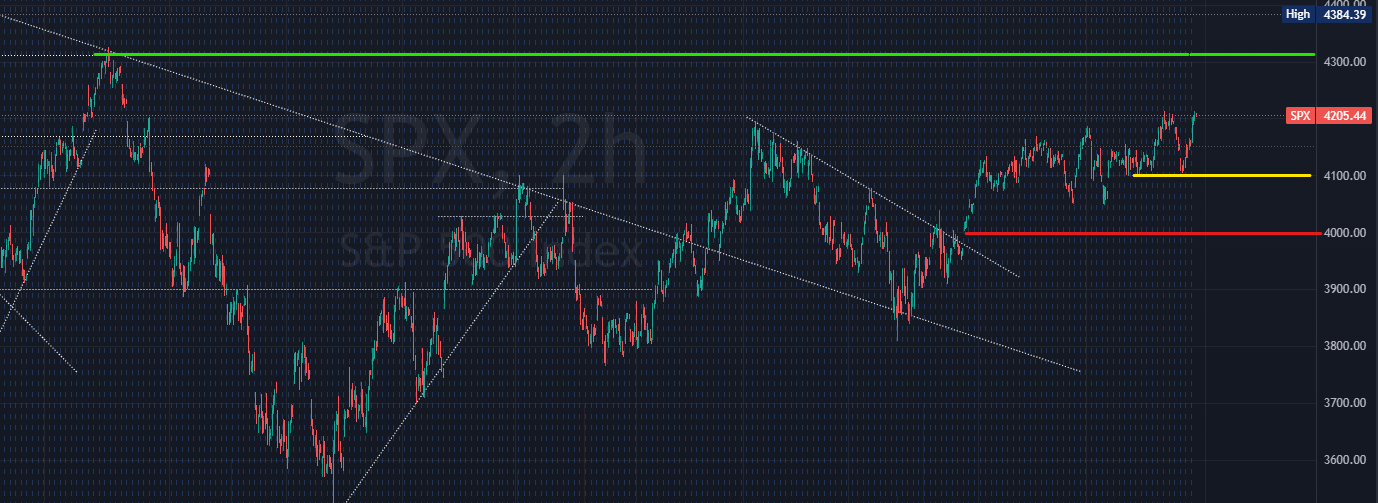
Looks pretty clean since we're on 4200.
Green - Zoom out we get 4300 as the next resistance
Yellow - Previous low right at 4100
Red - Next significant price point at 4000, just an additional note this area is also Fib 50%.
Prediction
With a shorter week ahead, I'm leaning towards SPX just hanging around and above 4200 for the week. But as always to be safe.
SPX above 4100
Paper Trade

Go for a more aggressive approach, Iron Condor between 4150-4250. This gives a risk reward ratio of 1:1 which is pretty neat. This also goes along with the thesis that SPX hang around 4200 for the short week.


Member discussion