29 Jan 2023 SPX Weekly - FOMC and Mega Earnings

Accuracy: 47/52 (90.38%)
SPX above 3800 - Correct
No Paper Trade
Last Week
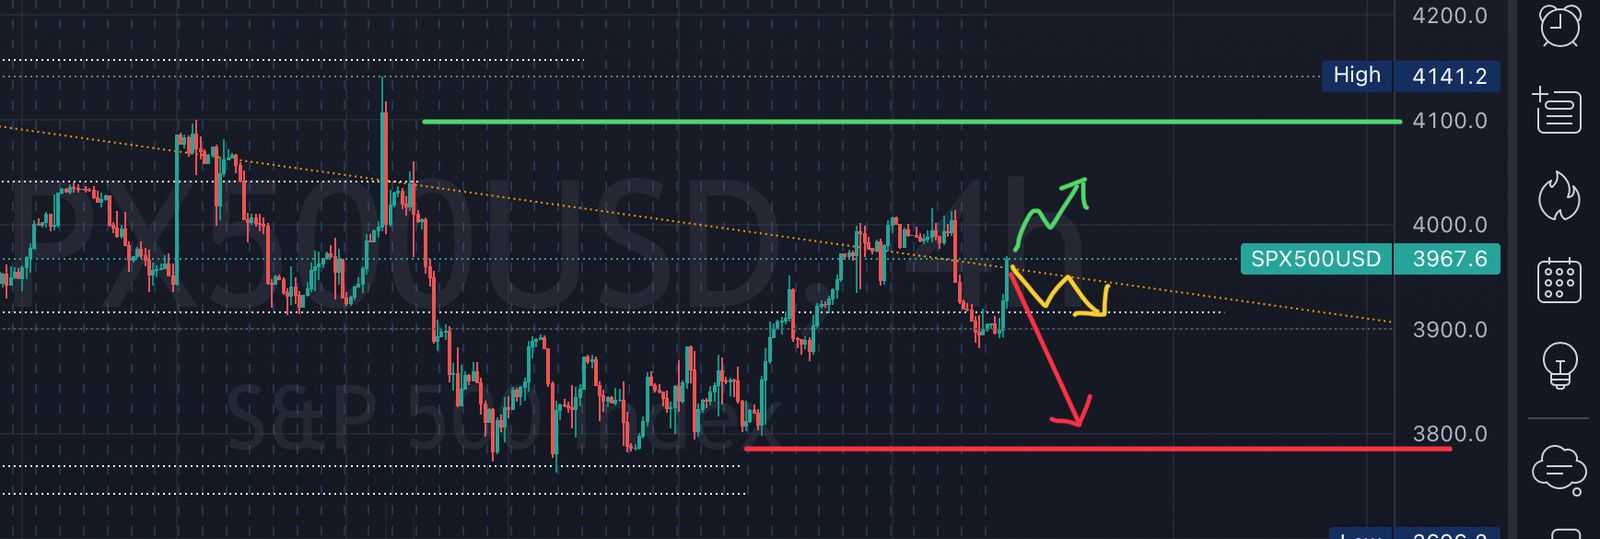
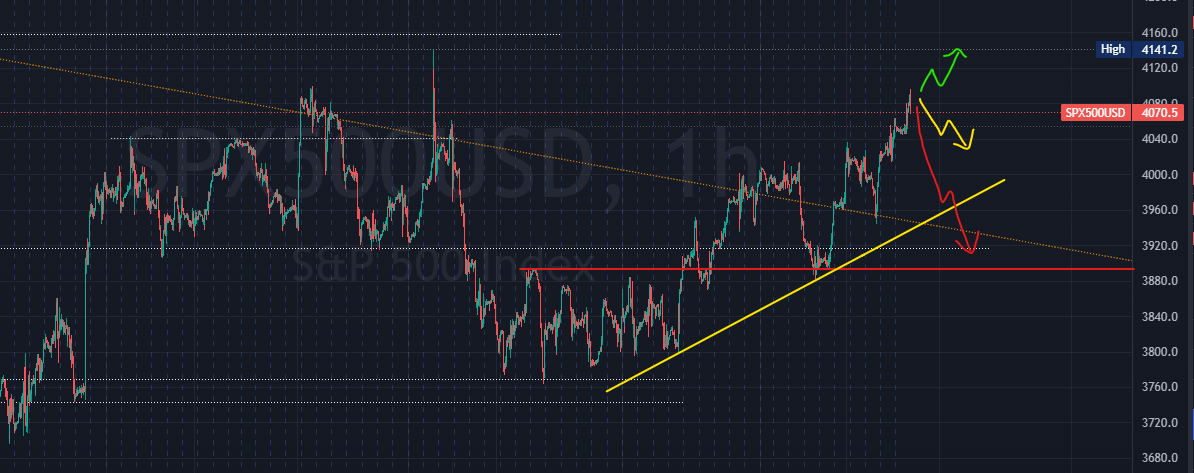
This is what I drew (below).
This is how it look like now (below). Both is 4h chart.
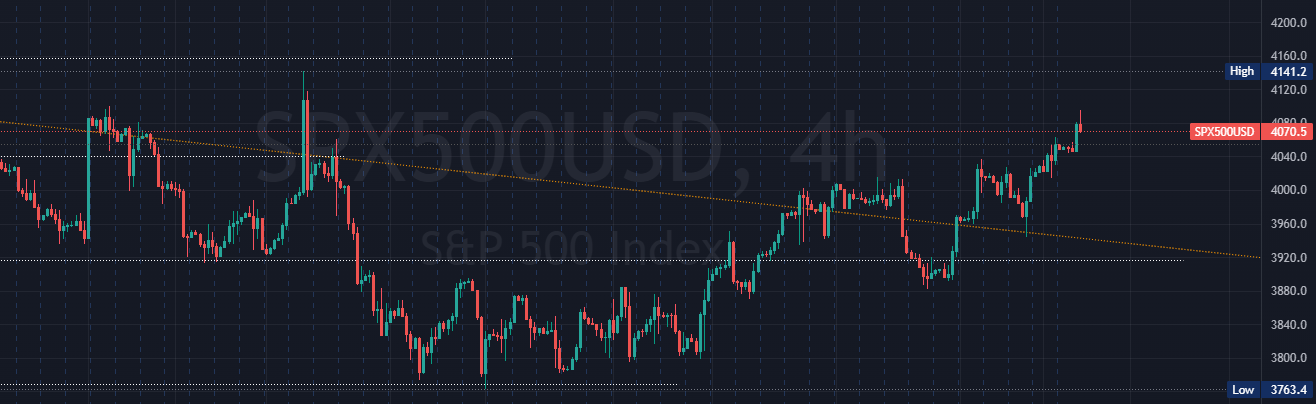
I also said I'm kinda leaning bullish which kinda got it right.
SPX has now confirmed that it broke the 1 year long downtrend resistance.
Economic Events
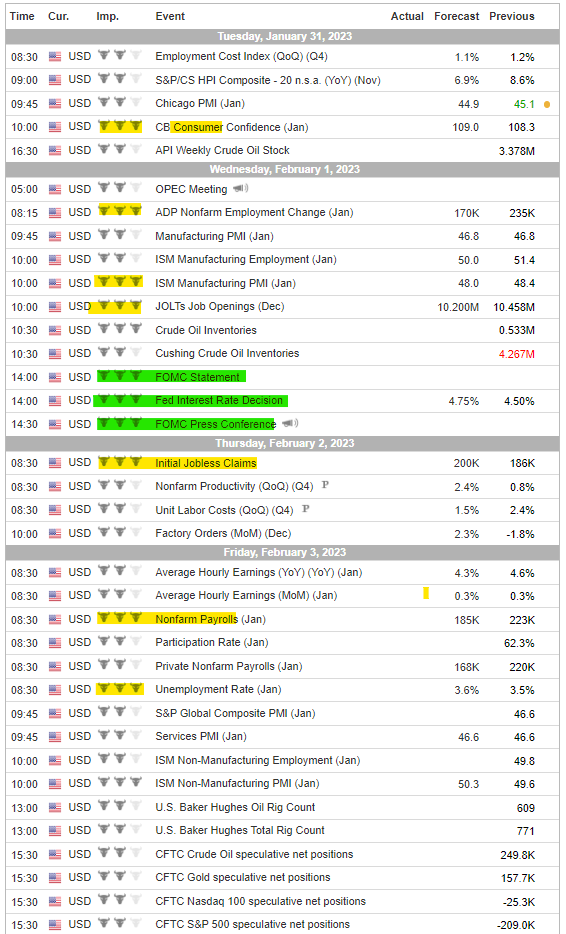
We have our usual (yellow) weekly or biweekly events that is of more volatility. What's more important is (green) FOMC on Wed. By now, if you've followed this series, you're realise its kind of a cycle we're going through every few months. Just that the macro economics states might be slightly different in all the related factors.
What's slightly different this time for next week is, it comes together with Earnings of Mega Cap stocks! We've got a combo this time.
Earnings
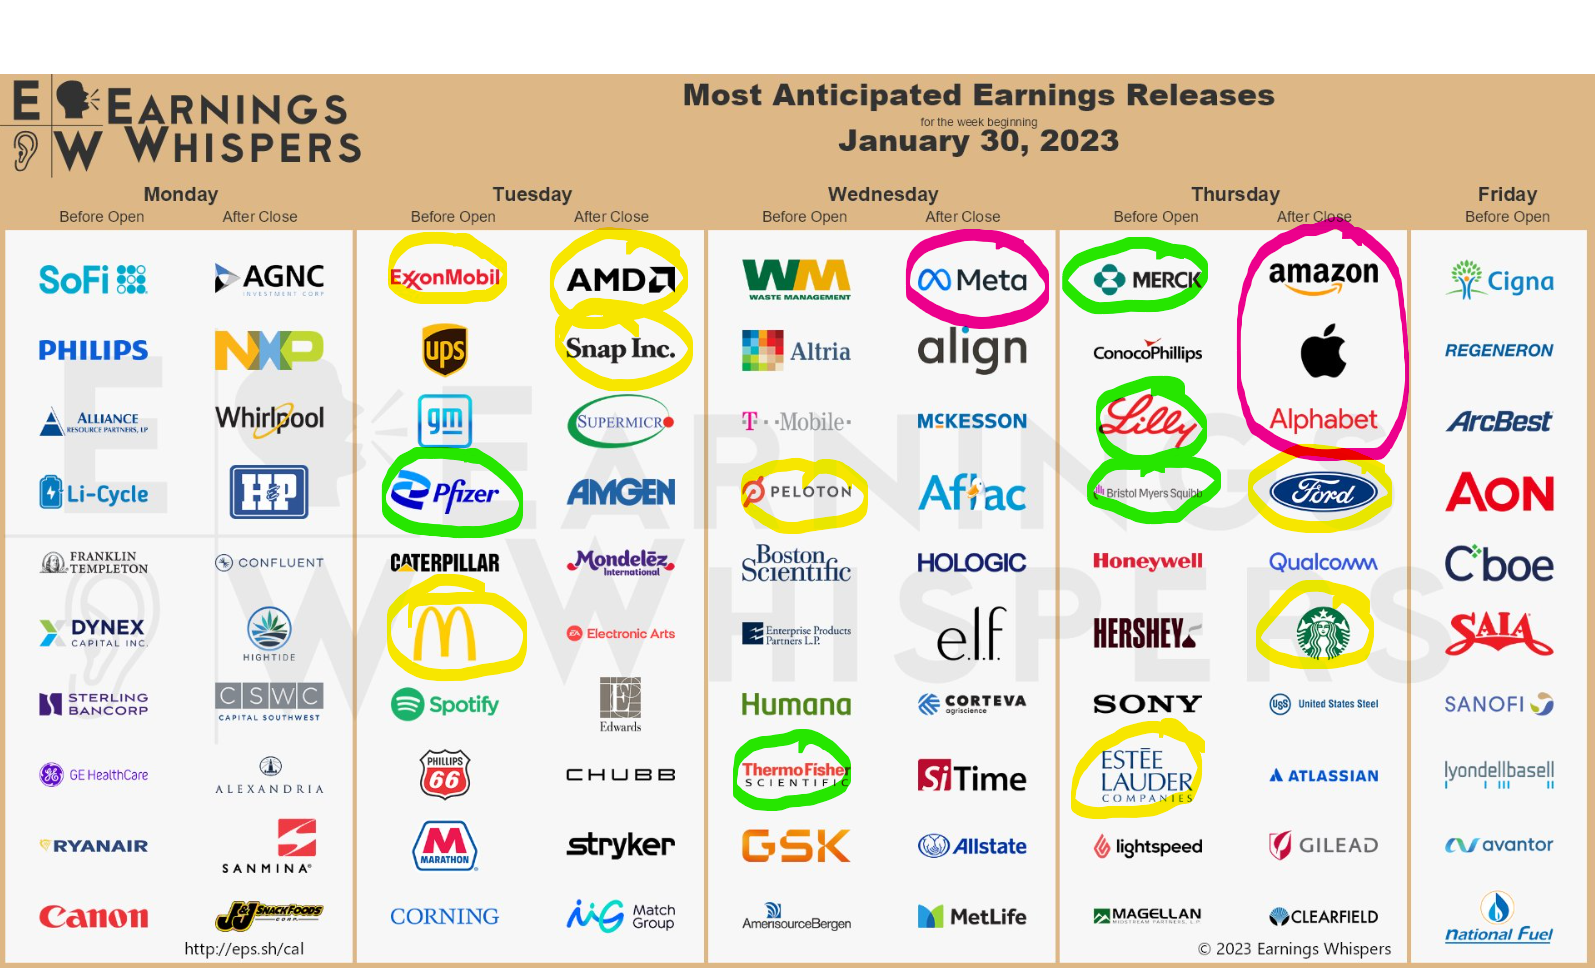
Pink - Mega Cap stocks, these stocks are in the top 10 of SPX and easily move the market if they alone have a big enough move.
Yellow - Significant big names, often enough to move the sector as investors anticipate other companies of the same sector will have similar earnings and forecast.
Green - Biotech, Healthcare seems to be quite heavy this coming week too.
There are probably more big names within that chart that I missed or didn't really highlight but the overall idea is there.
Next Week
Looking at the earnings alone it totally feels like its a volatile week. But we are also having FOMC in the middle of the week. It's gonna be so fun to watch but tricky to trade.
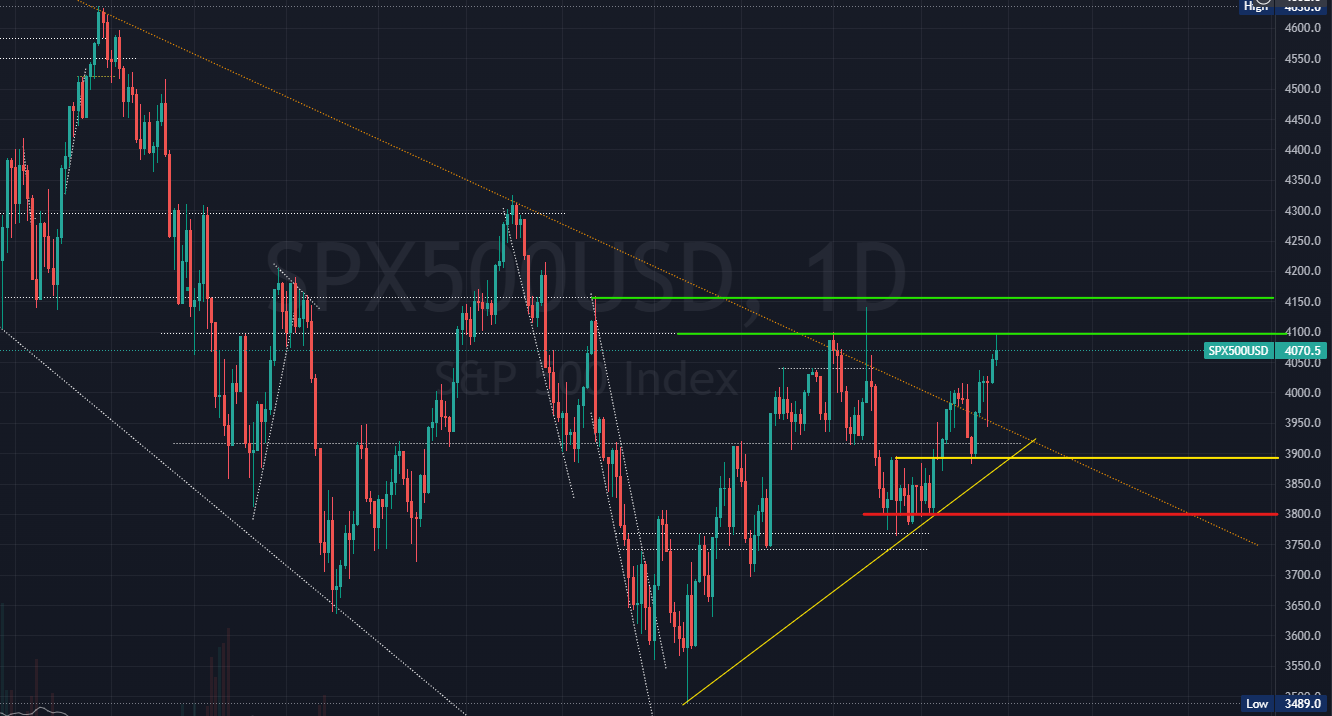
Drawing out the support and resistance on the daily candle chart first before going into lower time frame.
Green - bullish momentum continues, we break above the 4100 area that wasn't breached last week.
Yellow - We consolidate but have more downside than upside move anticipating a slight pull back on this uptrend. 4000 area might be a good area to sit on.
Red - Bad things all come together, we drop right to the next key support of 3900.
Prediction
We're kinda on an uptrend but also expecting some pull back before going higher. My analysis leans towards the bearish side more towards the Yellow case. But with FOMC + many huge earnings going in, I'm also kinda expecting potential bigger moves. So putting buffer towards the Red case.
SPX above 3900
I with the optionstrat for awhile trying different combo and can't really find a trade to fit into next week. Mainly because we're on an uptrend and expecting a potential pull back with too many catalyst. I'll skip.


Member discussion