30 April 2023 SPX Weekly - Momentum

Accuracy: 59/65 (90.77%)
SPX above 4080 - Correct!
Paper Trade
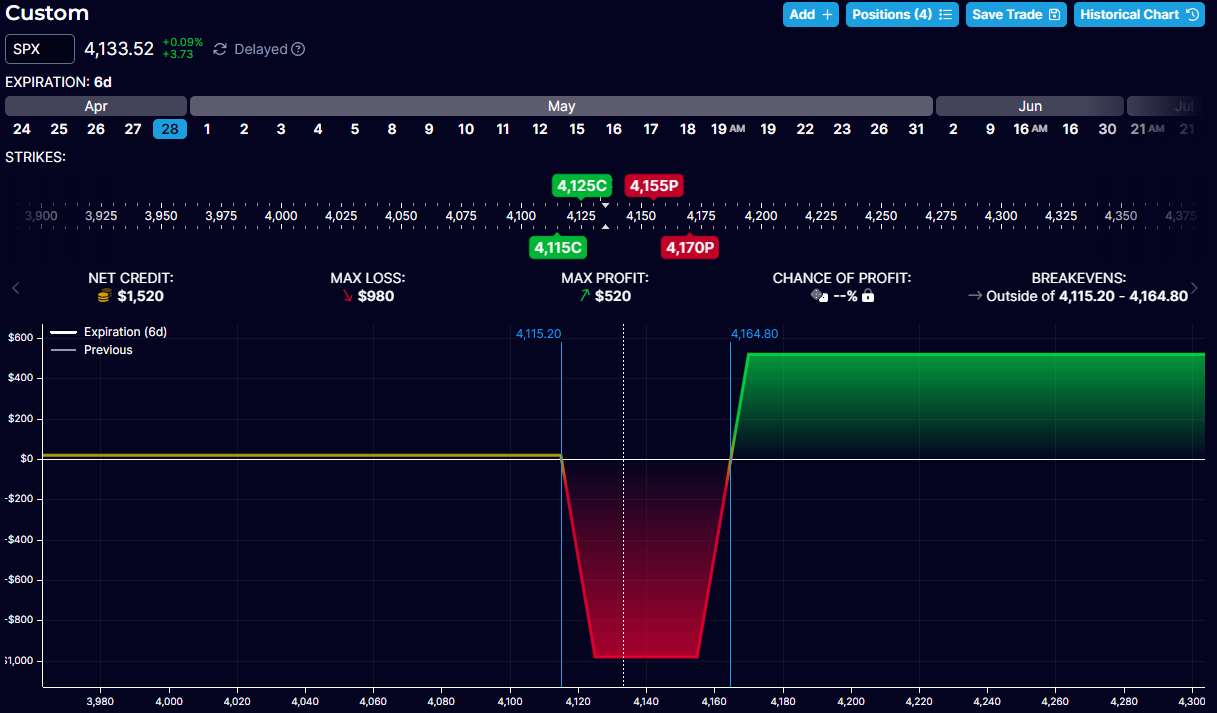
With SPX closing at 4169, the unbalance is $100 below max profit of $520 which should be $420. SPX did go the direction I predicted last week towards my profit side. I find this weekly IC play is interesting as long as we keep the risk reward ratio consistent, in the long run things will play out.
Last Week
Start with looking at the daily candle chart, last week's daily candle was a bullish pinbar or we can also call it a hammer. Generally that's a bullish sign as it means the buyers are taking over.
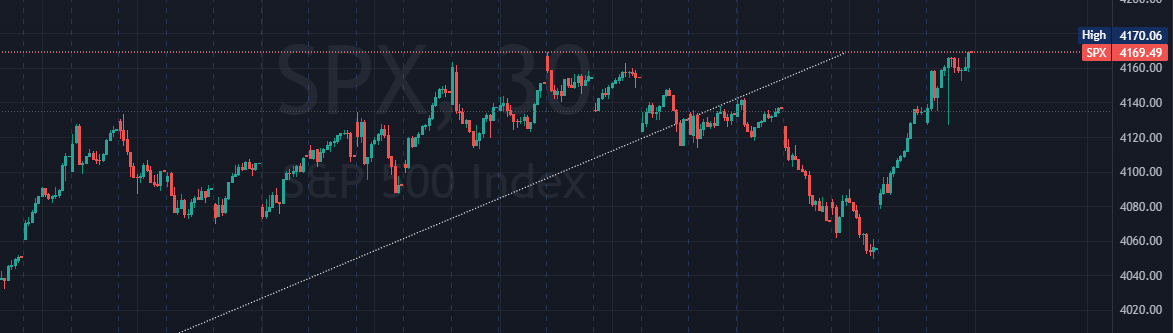
In the 30 minute chart, we see SPX friday close right at the top of the previous high. The rally started on Thursday which I believe one of the possible factor is because of Facebook earnings. META itself shot up 14% that day.
Economic Calendar
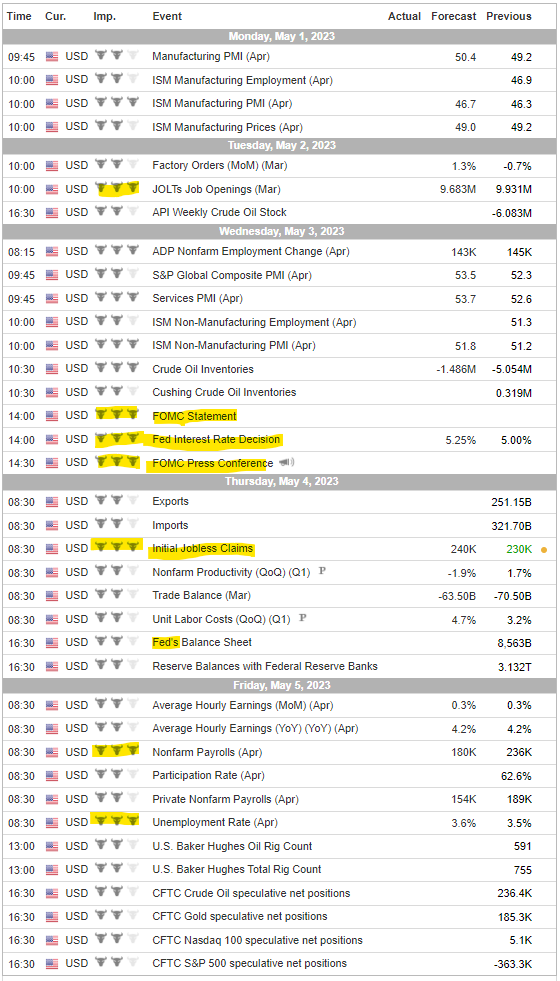
We're at FOMC once again. I do start to realise the FOMC volatile effect starts to tone down quite alot compared to last year, not that it won't have any impact but I think the wave of earnings will cause more volatility than this FOMC alone. At least for the upcoming weeks, earnings should be the focus on market movement.
Earnings
The biggest name from the mega cap everyone is looking forward to is definitely AAPL. Most of the mega cap had their fun last week, generally it does seems more bullish effect than bearish. Together with AAPL is quite many large cap companies which might cause more news stirring somehow or another.
With FOMC and AAPL, 2nd half of next week should be exciting.
Next Week
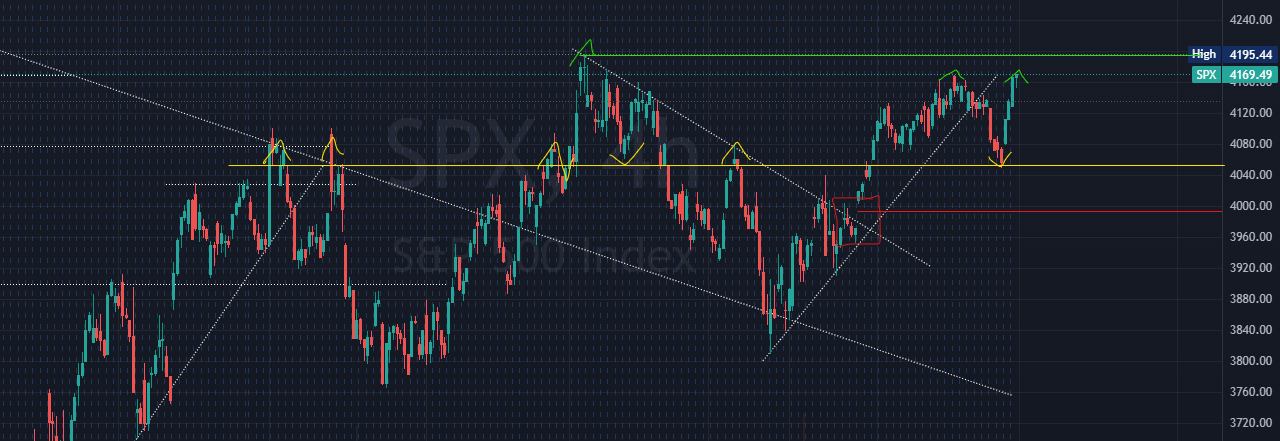
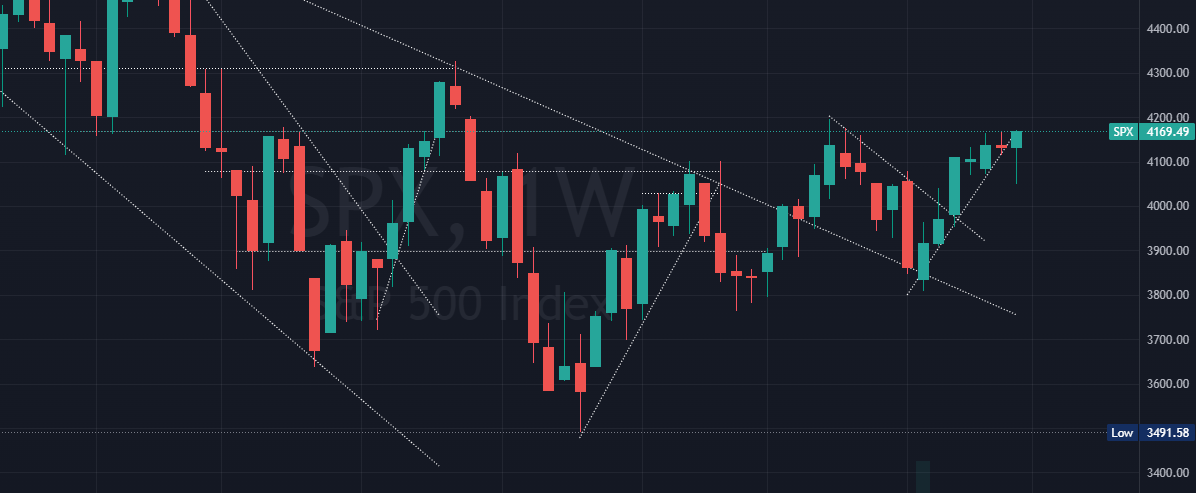
Using the 4H chart to see more things within the screen.
Green - 4195 high is the key area to break upwards, specifically rounding the 4200. So breaking above 4200 is critical to see higher highs.
Yellow - 4050 previous low/dip, also coincides with some of the previous resistance/support areas.
Red - 4000 area, there's a pretty huge gap up there. Possible if market comes back to fill that gap before going higher. Although might not be so soon but definitely some levels to watch out for. This gap area is also the fib 50% level.
Prediction
Mostly I think it's a momentum continuation. If FOMC interest rate is well within expectation no surprise, AAPL continue the good earnings outcome, most large cap keeping their good news coming, we should see higher highs maybe with some small hiccups. But I do thing any negative news will just move the market down for a fast correction, so always manage risk well.
SPX above 4050
Paper Trade
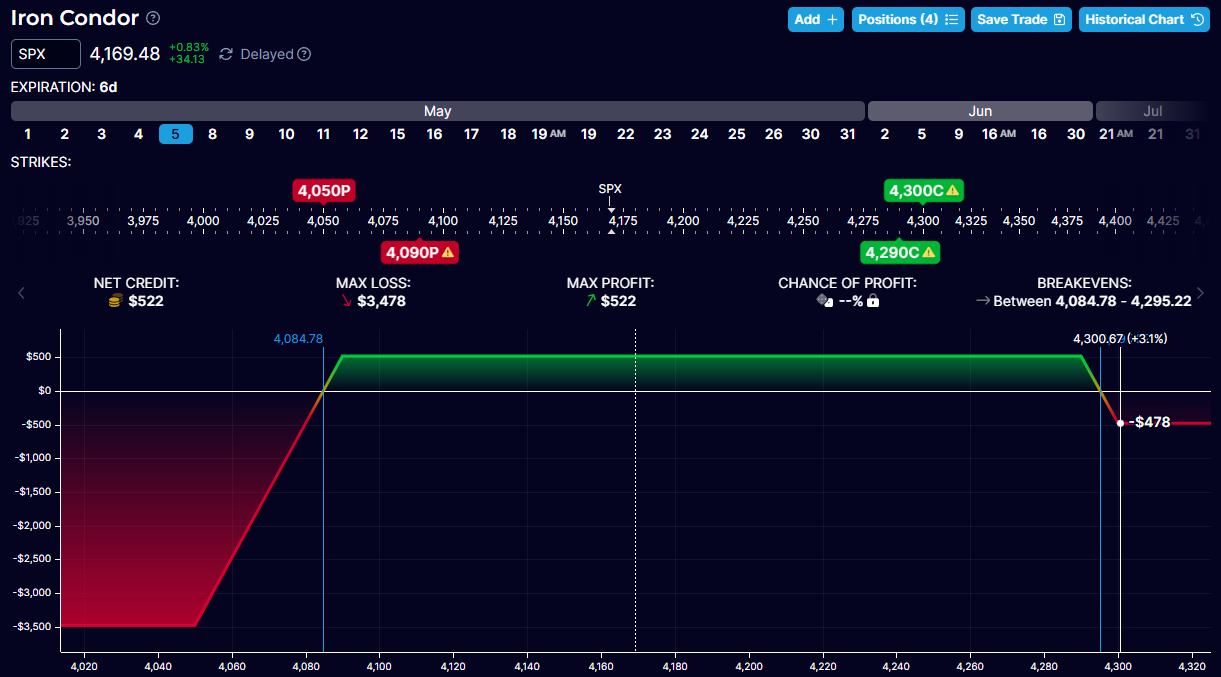
Another unbalance iron condor skewing the upside slightly. Collecting $522 credit and profit zone is between 4085-4295. If it goes above 4295 the risk reward is about 1:1.1 which is pretty good. There's more risk on the downside if SPX goes below 4085 by next Friday. For such higher max loss downside risk, usually a stoploss should be set to prevent max loss. But it's paper trade so it's kinda hard to do that here. I'll just put a rough estimation for stoploss, if SPX moves below 4080 before it expire I'll treat this trade as 2:1 risk reward simulating stoploss. Means lose $1000.
This trade kinda suits the thesis I have for next week.


Member discussion