4 Apr 2022 SPX Weekly - Uptrend

Accuracy: 13/17 (76.47%)
SPX above 4417 - Correct
Last Week
SPX did hit a resistance like I predicted in my post last week.
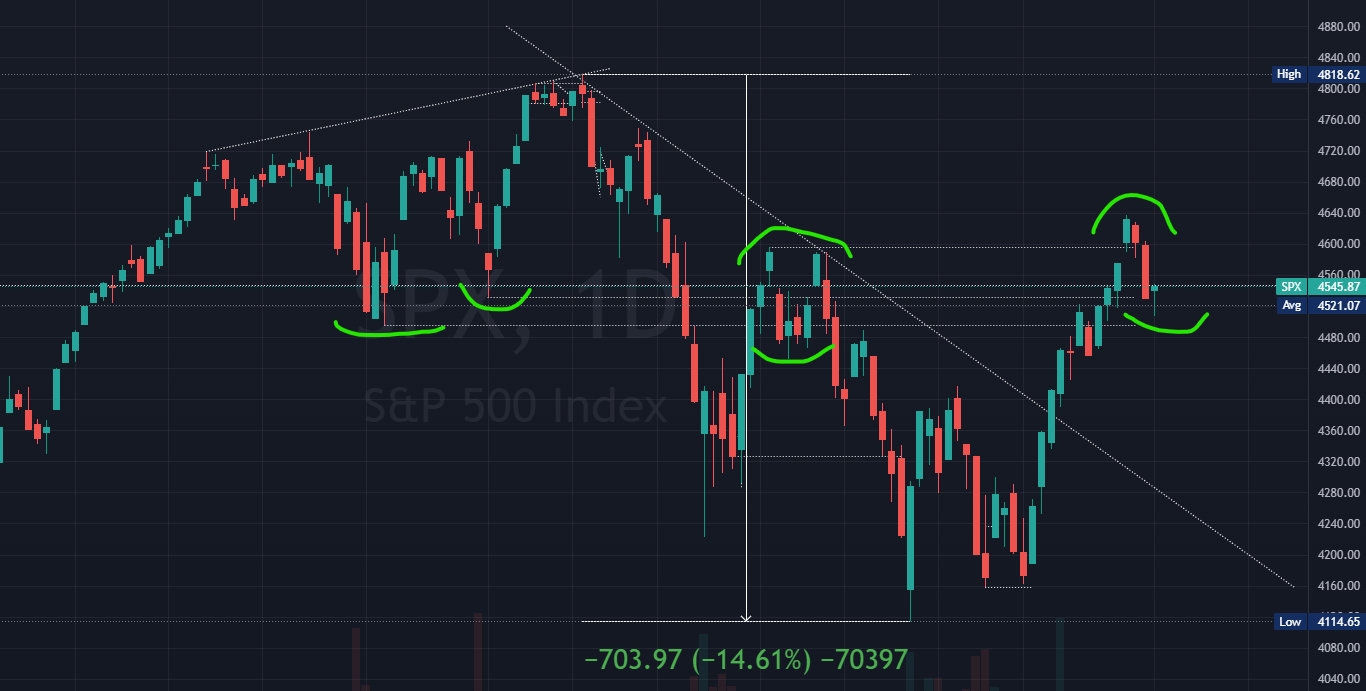
Price rejected near the 4640 area before coming back down pretty fast almost going near 4500 on Friday. This also forms a higher high, higher than the highs in Jan-Feb period. Also the bullish pinbar candle we have on Friday seems to show some signs of support.
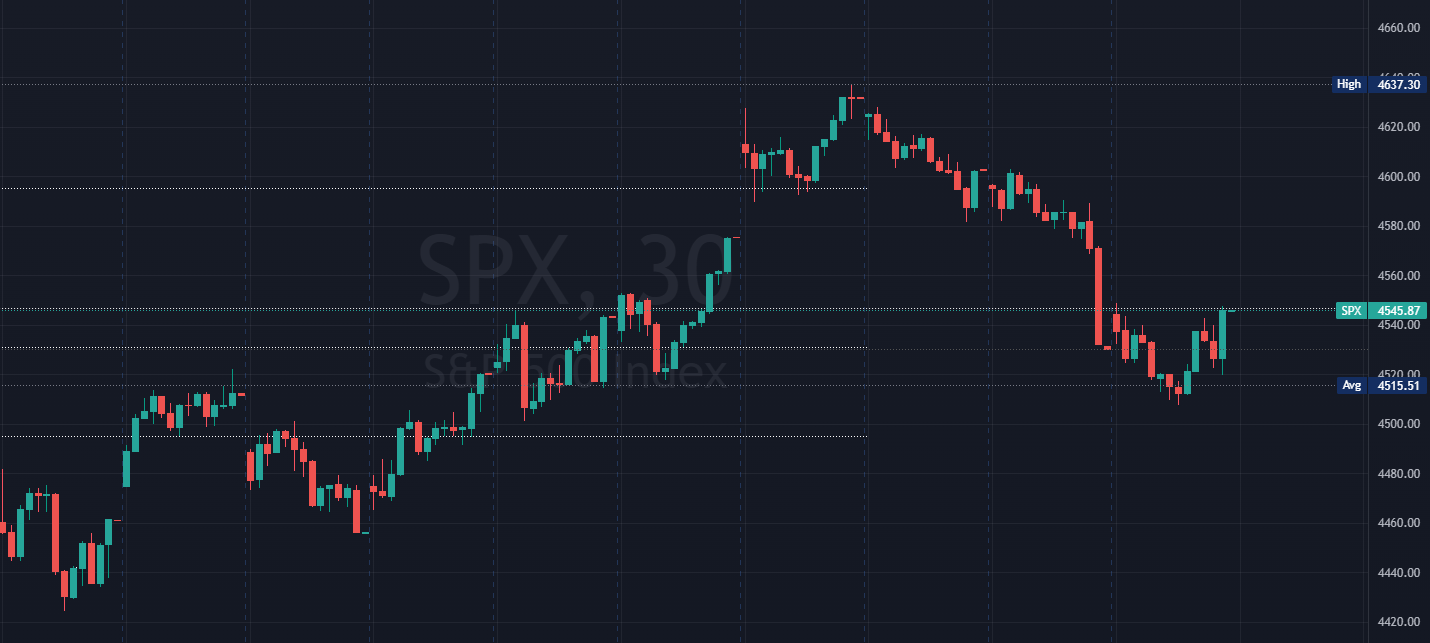
Zooming into 30 minute chart, we see Monday and Tuesday continuing the momentum higher followed by Wednesday and Thursday pulling back to where we started the week. Then closing Friday with some bullish strength.
From the 30 minute chart, we are still in a short term downtrend from the last 3 trading days.
Upcoming Week
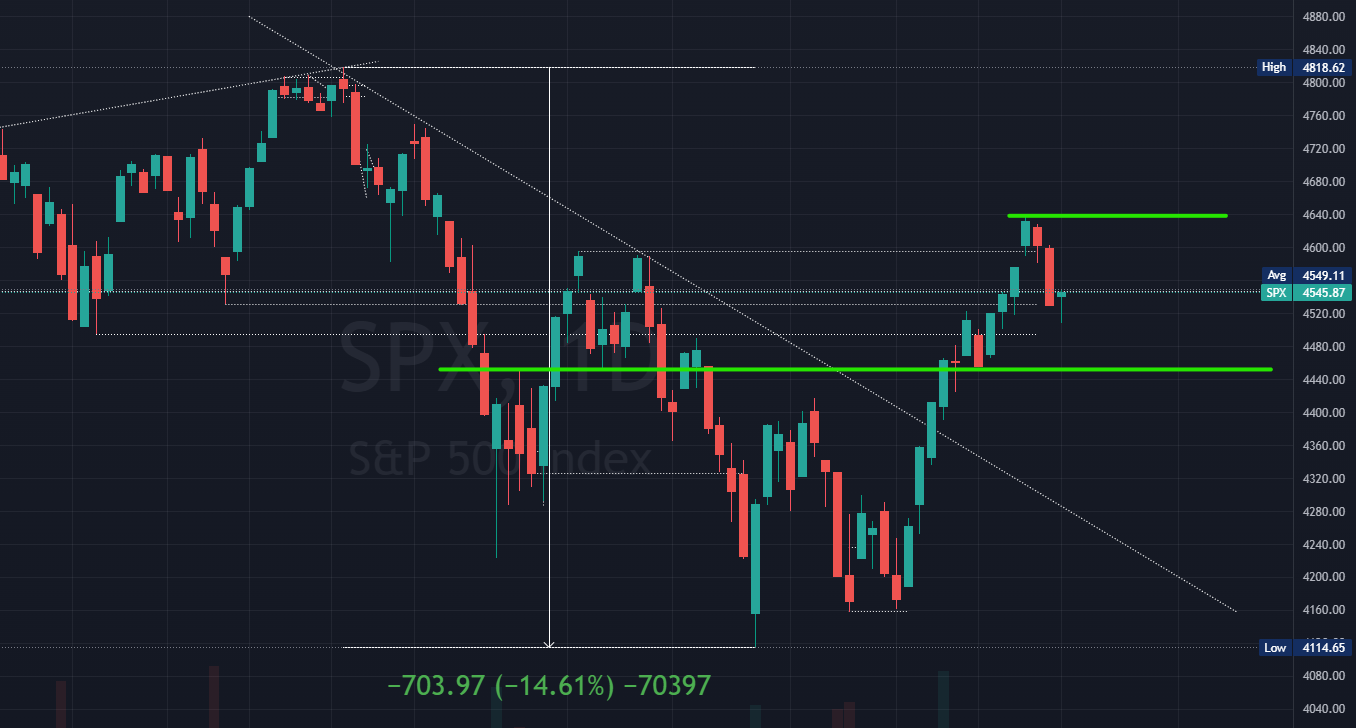
The current position we're at is in the midst of many support and resistance area. I've drawn where I think SPX will probably range within moving forward.
What we have in the daily candle chart looking at past 2 weeks of action, we are on a uptrend here. But I mentioned above looking at past 3 days price action on the 30 minute chart we are on a shorter term downtrend. This is a confusing analysis I have to agree but this is what always happens when we look at multi timeframe.
Just keep in mind that the higher timeframe (daily candle) will always have more strength than the lower timeframe (3o minute candle). So, we would expect the shorter timeframe to find a support before continuing the higher timeframe trend.
So from a 1 week projection perspective, either we bounce off from Friday's bullish pinbar or we get some more down moves before going higher again. In general, we remains a bullish trend momentum with the higher timeframe.
Economic Calendar
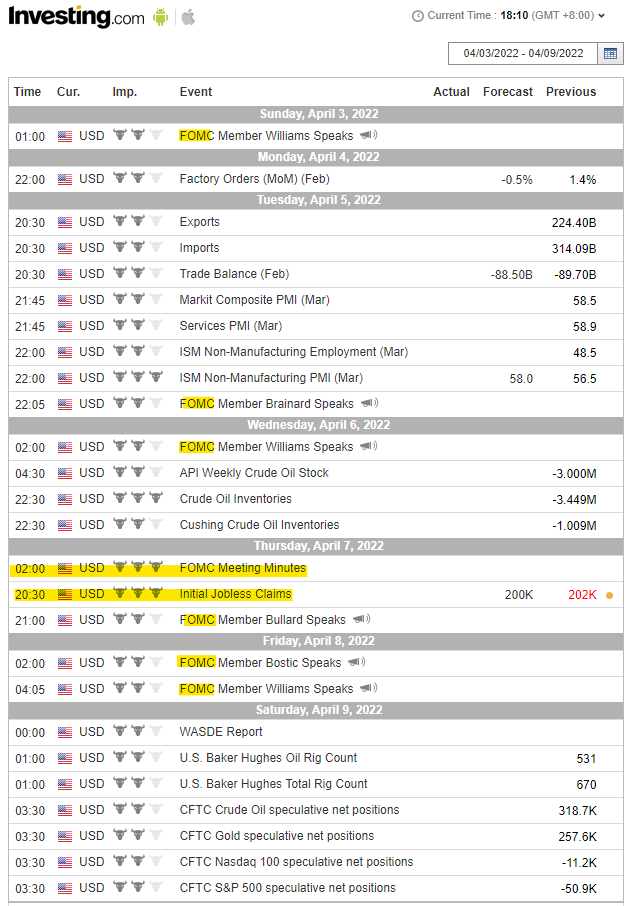
Next week the key event would be the release of FOMC Meeting Minutes and Initial Jobless Claims. Although most of the FOMC context are already bit by bit surfacing in the many FOMC member's speech, the meeting minutes sometimes could still have some swing in the market if something surprising is being said that wasn't publicly already known.
We also have many FOMC member speaking next week, although not critical but sometimes they also say things that surprise us too. So keep a watch out for where the market moves when they say something.
Earnings
Just a reminder that we are going to start our earning season again.
Although it's yet to be the mega cap earnings which are those that will really move the market, the start of these many mid cap companies does sometimes gives hint on how the general earnings forecast will be and market moves more to speculation than to actual reality.
Seasonality
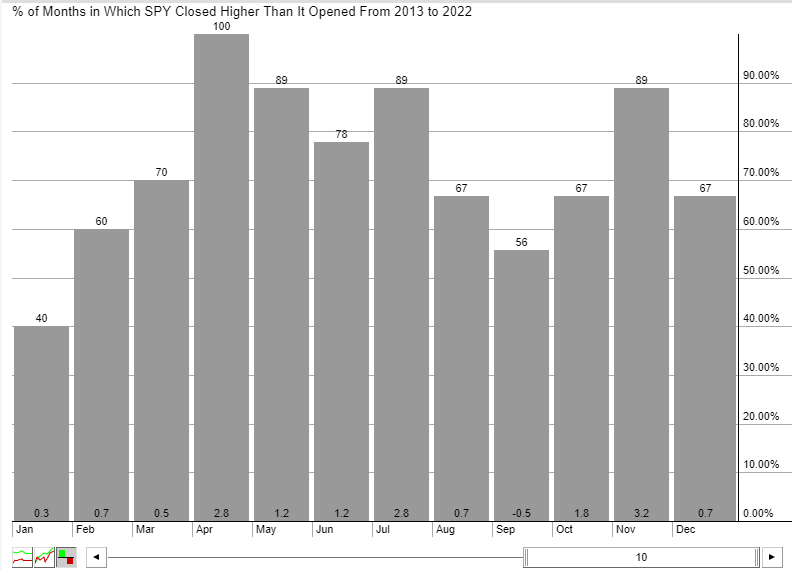
This chart is from stockcharts.com, where I used to take reference to check seasonality trend. What we see above is a 10 year history for SPY where the percentage of months in which SPY closed higher than it opened.
We can see that Apr - May, July and Nov are strong months that seasonally has more times it closed higher than it opened compared to the rest.
Since we're now starting Apr, this also adds as another factor to consider the trend moving forward.
Prediction
With all the above I put together, I'll still remain a bullish trend. Hope the earnings season bring some good momentum before we go into another FOMC cycle in May-Jun.
SPX above 4450


Member discussion