4 Dec 2022 SPX Weekly - I'm Back

Accuracy: 40/46 (86.96%)
SPX above 3800 - Correct
Vacation
Before I start my usual SPX weekly template, just want to kinda explain why I was missing for 2 weeks. Went for a 2 weeks holidays to USA through the Black Friday period. So much driving and shopping that I got no time and energy left for keeping up this SPX weekly post.
Good thing is my options trading bot I wrote has been working pretty well and stable which continued my daily 0 DTE trading for me running on my computer back at home. All I need was to remote back to my computer and check if its running. Anyway I'll probably talk about this more soon as things starts to get mature. Stay tuned.
Last 3 Weeks
Back to business, my previous prediction on 13 Nov still played out pretty as per my expectation. Just pulling out the chart I drew back then to have a quick reference below.
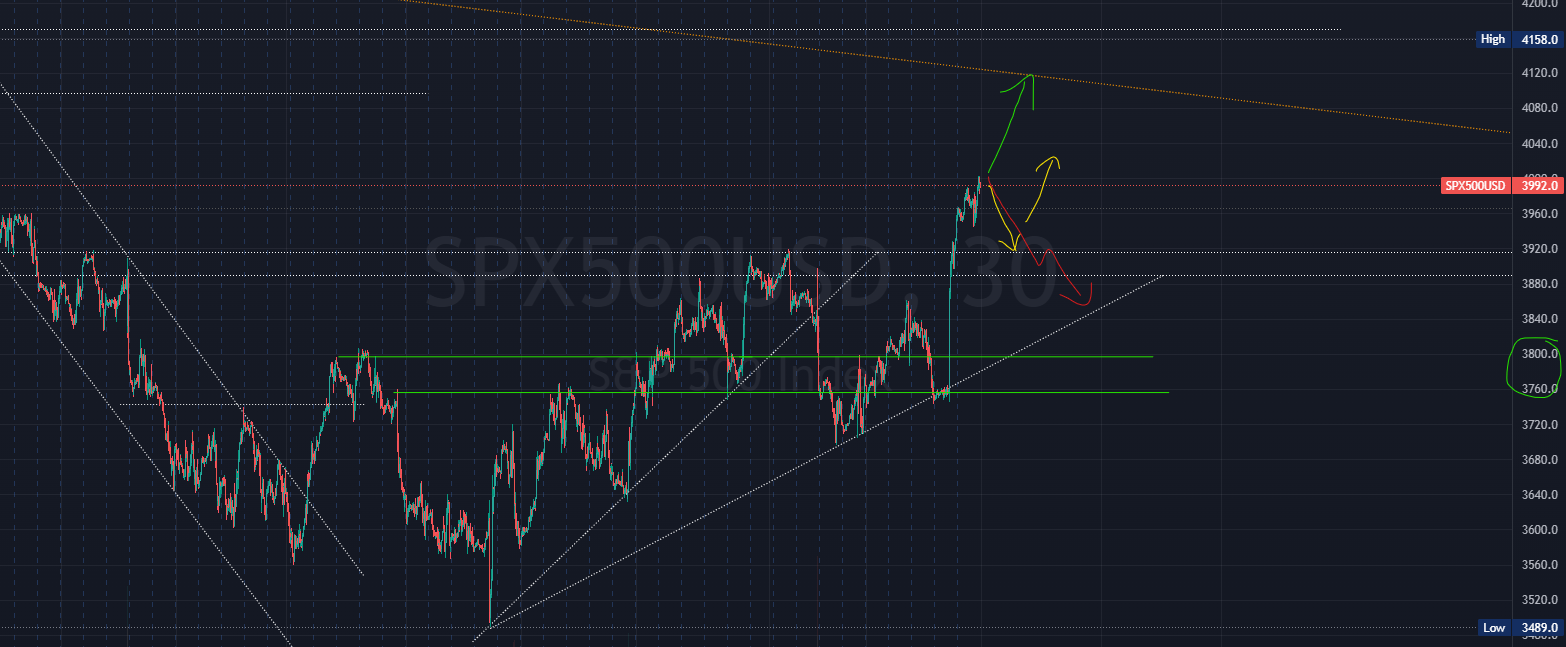
I probably forgot to mentioned back then, yellow case was my most anticipated one which came out pretty close. Let's see how the chart looks like now.

New perspective, the 4 hour candle chart. Over time, I start to not get so fixated to the time interval (candle). I sometimes jump around different timeframes just to see if there's a better visualisation.
What we see is SPX did came down and moved pretty much close to how I drew the yellow arrows. It even took 2 weeks to develop into it. This is also something I realised bit by bit as I do this analysis. My prediction sometimes happens abit later than I expected. Anyways, keep doing will slowly refine my skills I hope.
Focusing back at the chart above, it's interesting that now price action is squeezing towards both a downtrend resistance and a smaller timeframe uptrend support.
Next Week
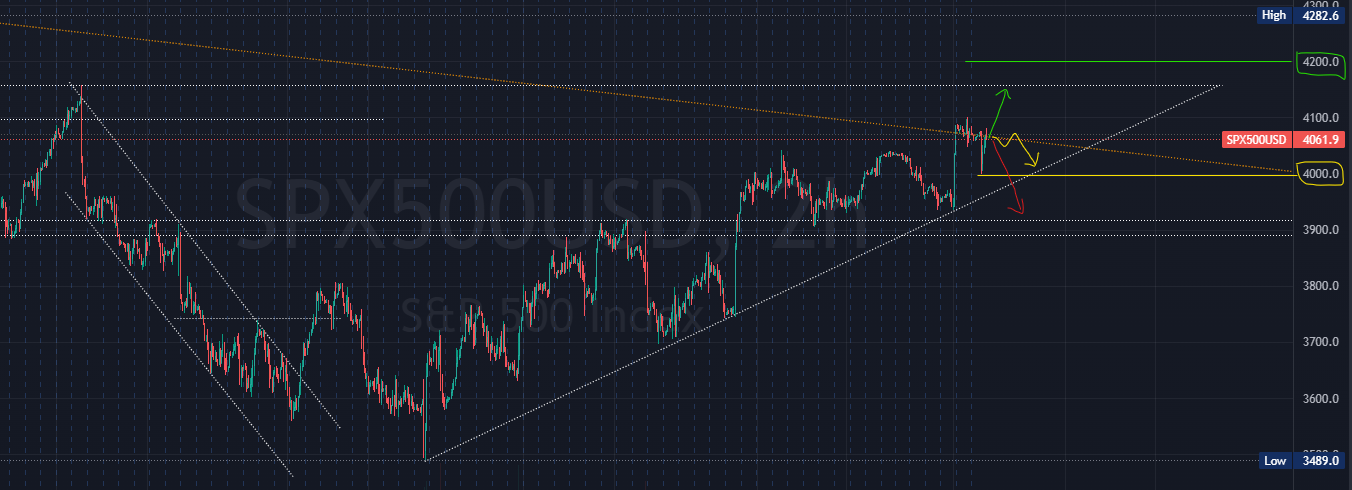
As usual, after drawing most of the trendlines, support resistance, I'll play out 3 possible scenarios according to these lines. Key areas to note is 4200 on the upside and 4000 on the downside.
Past 2 weeks breaking up above 4000 has been a strong bullish sign with good news slowly coming out regarding inflation. Feds getting less hawkish and accepting inflation is coming down but also mentioned this high interest rate might last longer than expected.
Yellow remains my most neutral and probably prediction. Continuing the short term bullish momentum, some consolidation before any major movements. Talking about major movements, lets look at economic calendar.
Economic Calendar
Something different this time. let's look at next 2 weeks of economic calendar.
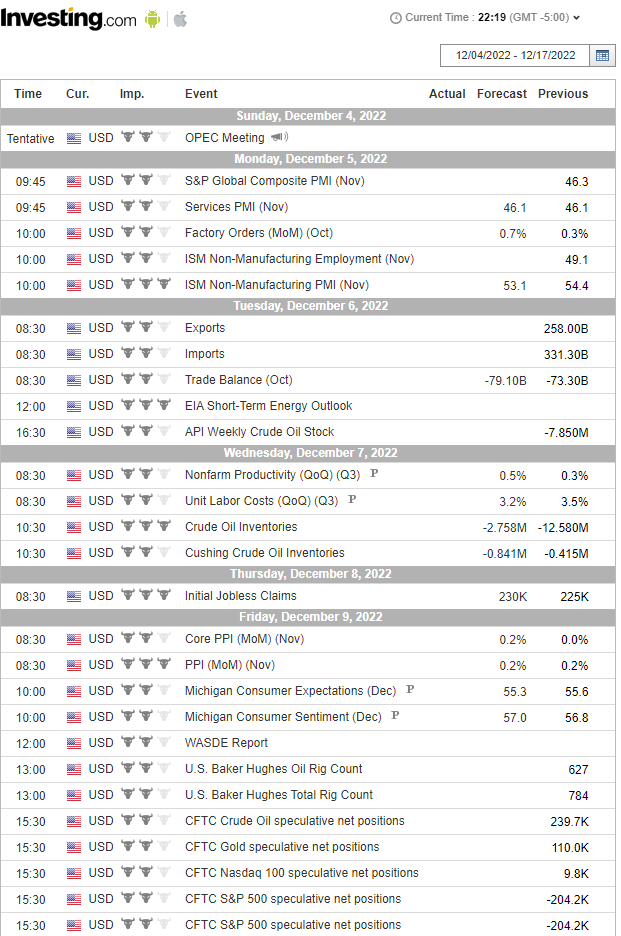
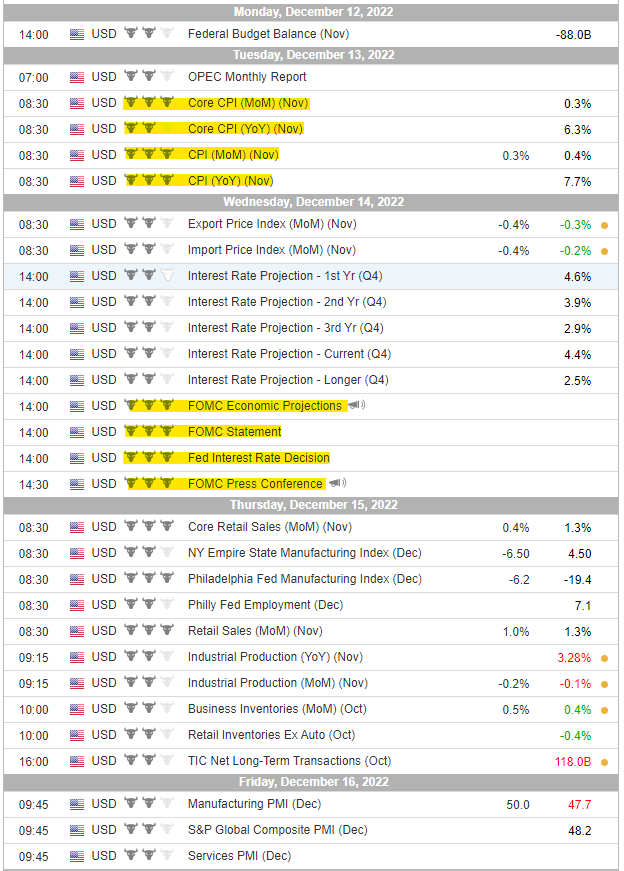
Why I'm showing 2 weeks this time is because the next CPI and FOMC is coming the week after on 13-14 Dec. Next week itself the only volatile events are probably jobless claims and PPI which compared to CPI and FOMC are relatively minor.
With that huge back to back event coming the week after, I'd expect next week remains consolidating within the current range. Then CPI/FOMC be the deciding factor to break upwards or downwards.
Prediction
I think most cases matches my yellow scenario but as usual with more margin for error, following the current uptrend, I'll take the next support area as the defense line.
SPX above 3900


Member discussion