5 Feb 2023 SPX Weekly - Confirm New Trend But...

Accuracy: 48/53 (90.56%)
SPX above 3900 - Correct
No Paper Trade
Last Week
3900 was my safer play as I was kinda expecting a potential pullback after a break upwards of the long term resistance. Seems like the bull is not holding back despite FOMC and Mega Cap earnings.

First let's look at the higher time frame SPX daily candle chart. Not only we see clear break of this long term downtrend line (orange), we also break above the previous highs that was rejected by this downtrend line. We barely touched the 4200 mark and started to see resistance. Let's go into smaller timeframe to see how the big events moved SPX.
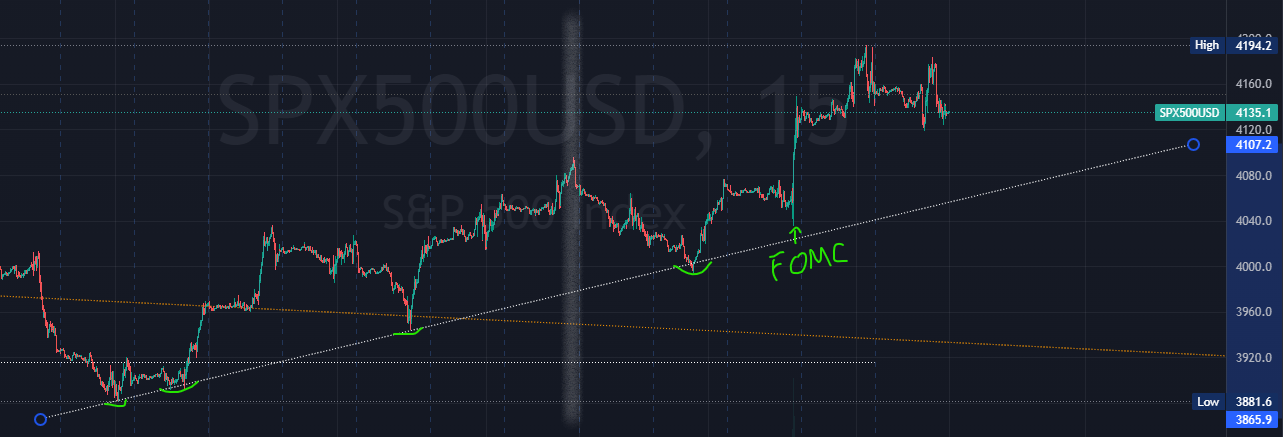
The week actually started moving downwards and finding support on an uptrend line until FOMC on Wed which rallied pretty strongly. Feds admitting inflation coming down and playing less hawkish is giving the market alot of confidence.
What's interesting after FOMC is the Mega Cap companies announcing their earnings, which doesn't seem to be as bullish as it seems. Market seems to have some mixed feelings mainly because their earnings isn't really that pretty.
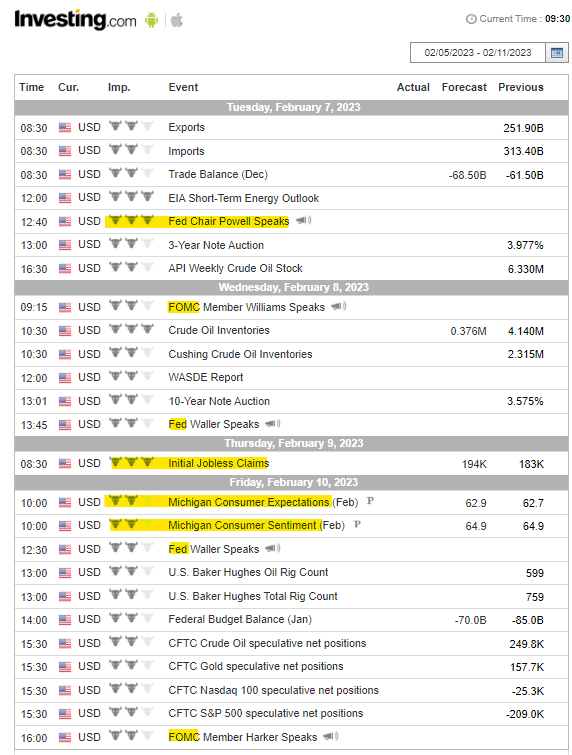
Economic Events
As usual, after FOMC these Feds like to come out to have few more continuation talks. My take on this is that from the FOMC itself the market already reacted pretty much to it on the upside. I don't see any how these follow up speeches can bring higher highs. I lean towards a bearish sentiment towards these speakers maybe because of the strong rally, they might come out to cool things down and play a slightly hawkish stance.
Usual events to look at, Initial Jobless Claims and Michigan Consumer. These might have a little movements for that day, don't think they will be the catalyst to set any trend going.
Earnings

Not much to highlight here, it's pretty much continuation of many large cap earnings releases. I don't foresee any market movers unless some really surprising news surface.
Also, since the big brothers (mega cap) didn't do well. It's more likely that these mid-large cap are mostly going to show more bearish effect than bullish.
Next Week
Keeping it cleaner this time.
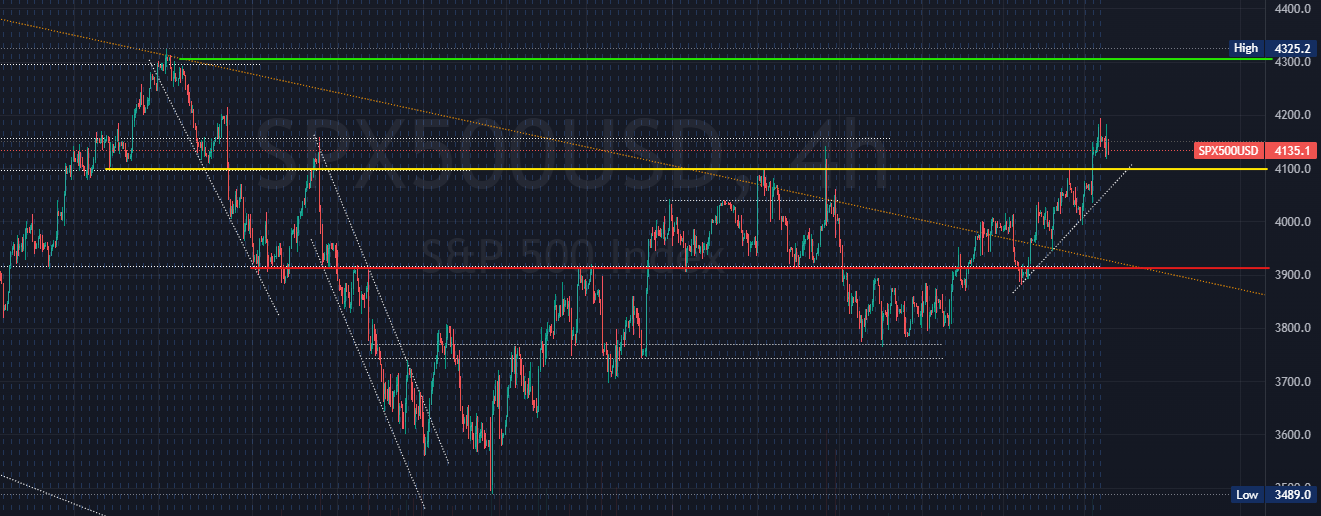
- Green - 4300, the previous time that downtrend line rejected
- Yellow - 4100, short term uptrend support
- Red - 3900, retesting the downtrend resistance line
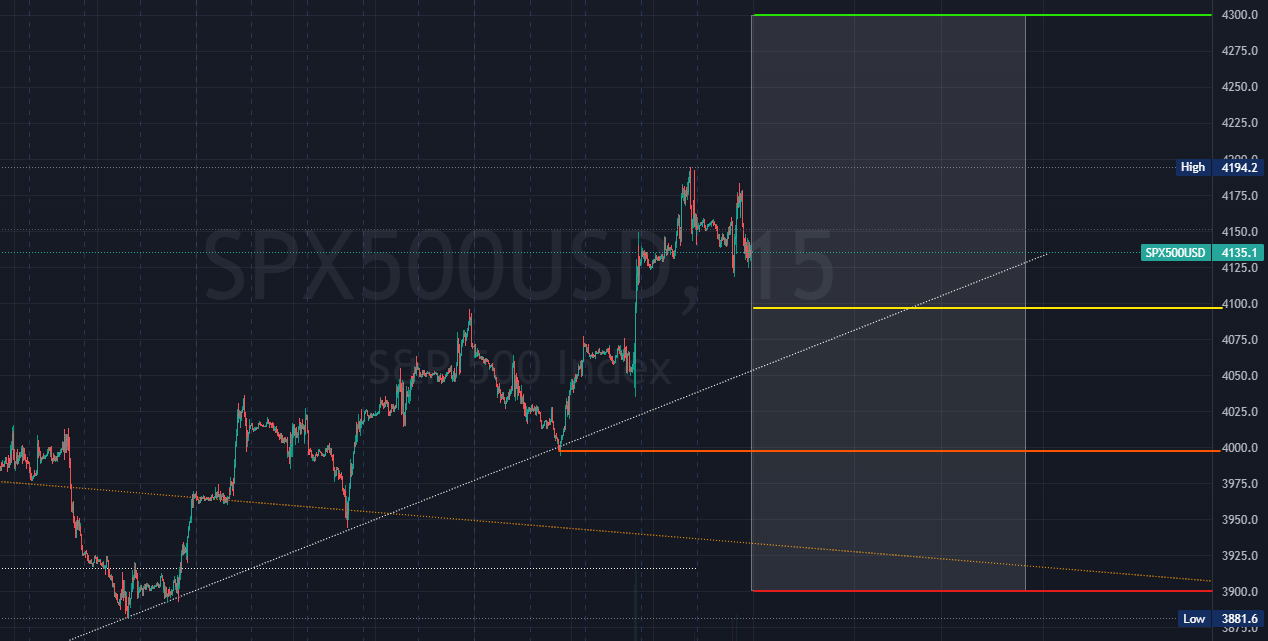
Zoom in one more time frame, added an Orange line where it previously tested the uptrend support at 4000. This might be the more important area and number to look at.
From the current sentiments after FOMC rally and mega cap mixed, SPX is currently at an even higher high area where last week I'm already expecting a potential technical pullback. Next week I remain my stance on this pullback happening and probably with abit higher weight than last week.
Prediction
As much as I also love the market going up, afterall I do have long term holdings. The analysis above does lean more bearish than bullish. Be it technical or market sentiments. I will usually, most of the time, follow the recent short term trend but sometimes there's just exception cases. Of course, with some safety if I'm wrong.
SPX Below 4300
Paper Trade
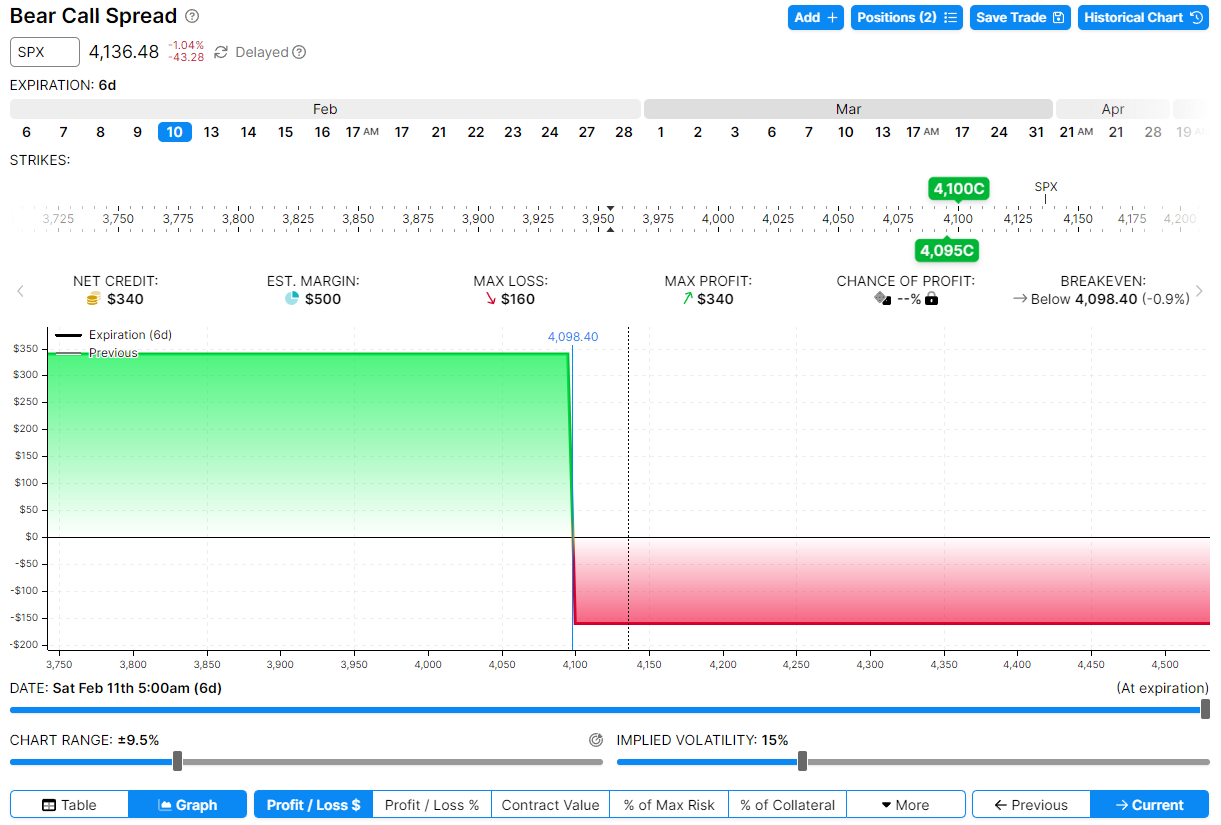
Kept it simpler this time but something different. In the money (ITM) credit bear call spread. Since I have more bearish bias, this setup is pure directional with about a 1:2 risk reward ratio. So either I win 340 or lose 160.
Few thoughts process in this paper play:
- Having it 5 wide for bear call spread makes it more conclusive than a wider spread. For extreme comparison, to have a similar 1:2 risk reward on say a 50 wide needs SPX to go further down like 4000. Which makes it harder to fulfil and also a much bigger margin and sizing.
- Doing credit bear call instead of debit bear put is basically trying to be benefiting from theta. But I'm aware ITM theta is actually against me, so this choice is really to add a stronger time sensitivity to the trade if I'm right. Means if SPX does go down to my target, I'll hit profit target faster than a debit spread.
- Choosing the 4100/4095 makes it very clear that this is the area I'm looking for SPX to break downwards, which looking at current market price closing on Friday is 4135. This target is pretty realistic.
- I'll probably not have a profit taking target since it's quite an absolute trade that it's either above 4100 or below 4100 by expiry coming Friday. Which is a 5 DTE trade.
All these consideration totally comes from one of my keyword of the blog - Simplicity.


Member discussion