Comprehensive Guide to 60 DTE Stocks Income Strategy

This strategy is not some aggressive strategy I'm trying to design. What I want to achieve is a consistent and fairly easy to manage strategy that works in a repeatable long term. The target return I'm looking at for this strategy ranges from 2-5% per month on average.
Just to list out the topics overview.
- My Statistics
- Trade Mechanics
- Stocks Selection
- Technical Analysis
- Option Chain Selection
- Trade & Portfolio Sizing
- Trade Management
- Special Handling
My Statistics
Let's start with my own statistics. I've been trading this strategy for about 3-4 months as of this post (22 Dec 2021).
Win: 46
Lose: 7
Win Rate: 88.7%
Average Days in Trade (DIT): 18
Average Return on Margin per month: 3%
The above statistics are my live trading outcomes so far. Note that I did tweak my configuration along the way to constantly improve and stabilise the strategy.
Trade Mechanics
Bull Put Spread or Put Credit Spread
Sell 1 Put at 15-19 Delta
Buy 1 Put at 5-10 wide away
Date to Expiry (DTE): 60 (45-70)
Delta: 0.15 - 0.19
Spread: 5-10 wide
IV Percentile: >30 (the higher the better)
Risk Reward Target: 10% - 12%
DTE - 60 is just a number I put to this strategy. I've tested from 30 to 45 to 60. To me, going further provides more consistency and margin for error.
Delta - 0.15 to 0.19 is just a reference. I try to keep within this range almost all the time to keep myself at a safe distance from the money. The key criteria for strike selection lies quite heavily on the technical analysis.
Spread - 5 wide is the default go to for almost all the trade. Some tickers might not be 5 wide depending on the stock price. Like AMZN being in the 3000 range, only has 10 wide sometimes. I've also tested 5-10-20 wide on various stocks, I don't see any significant benefit in terms of theta or vega. 5 wide provided the best risk reward ratio most of the time.
IV Percentile - Just to also put it here, although I feel it should be basic knowledge for people who are trading options. Higher IV simply means options price are more expensive. So we want to sell when it's expensive, so that when IV drops we also benefit from it. So far anything more than 30 IV percentile is good for setting up a trade. A reminder though, super high IV does not mandate a trade. Technical analysis is still a big factor to decide whether to enter a trade or not. In most cases, high IV simply gives a much further strike selection for better risk reward ratio.
Risk Reward Target - This is quite important to keep within 10-12%. Let me use an example, in a $5 wide spread, we would want to target $0.5-0.6 credit. So that's how we calculate the risk reward target. We want to keep it WITHIN 10-12% as much as we can to keep our strategy consistent and not bias to any particular trade. This is because this risk reward target is used for our trade management later. We have to keep it as consistent as possible to prevent any huge losses that may occur. In cases where you can get much higher than the 12% risk reward target at 15 delta, the default advice is take a further strike for better safety and keep the risk reward within 10-12%.
Stock Selection
I only trade on some of the strongest stocks on earth. There's a bunch of criteria for how I screen them. Let me share a quick list of top 20 stocks to add into your watchlist for this strategy. You can simply add them into the watchlist and evaluate the charts daily.
TSLA,NKE,AMZN,ADBE,QCOM,AAPL,PYPL,FB,NFLX,NVDA,TSM,DHR,ORCL,MSFT,LLY,COST,HD,ACN,V,PG
Although this list may exist for quite awhile, maybe years, but we want to have a way to keep updating this list of strong stocks. Simply head over to finviz and follow my screening filters. Use this finviz link to open the same filter below.
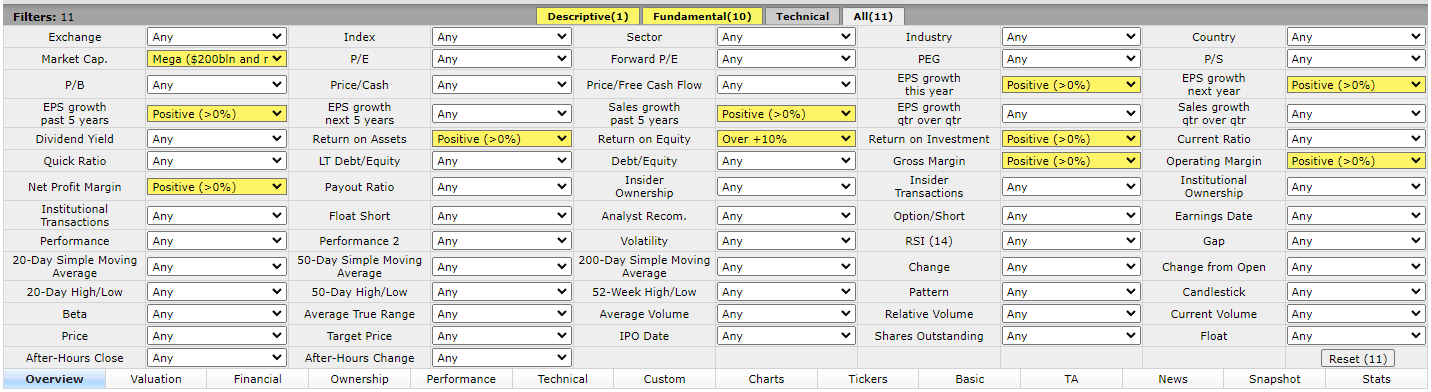
Simply speaking, this list is simply the biggest companies that have consistent growth and profits for the past 5 years.
DO NOT trade this strategy with all the speculative or meme stock, you will definitely be losing more than winning. This strategy only works with strong and reliable stocks as per the screening filter.
Technical Analysis
This is probably the most complex topic to talk about but it's also some of the most basic TA that are the most powerful. I'm not going to teach TA here, I'll point you to some really good and basic stuff.
You can browse through this Wysetrade channel to look at some of the other TA videos. More importantly, what we want to know is to identify support and resistance areas. And also keep in mind, the more confluence we have for each support and resistance area (for example, a trendline meets a support line that also meets a moving average), the more conviction it gives us.
So the key entry criteria:
- Current stock price is NEAR a support area.
- The options strike near 15 delta is at or below the NEXT support area.
- Risk reward target within 10-12%
For better illustration, lemmi try to take a current example for reference - AMZN.
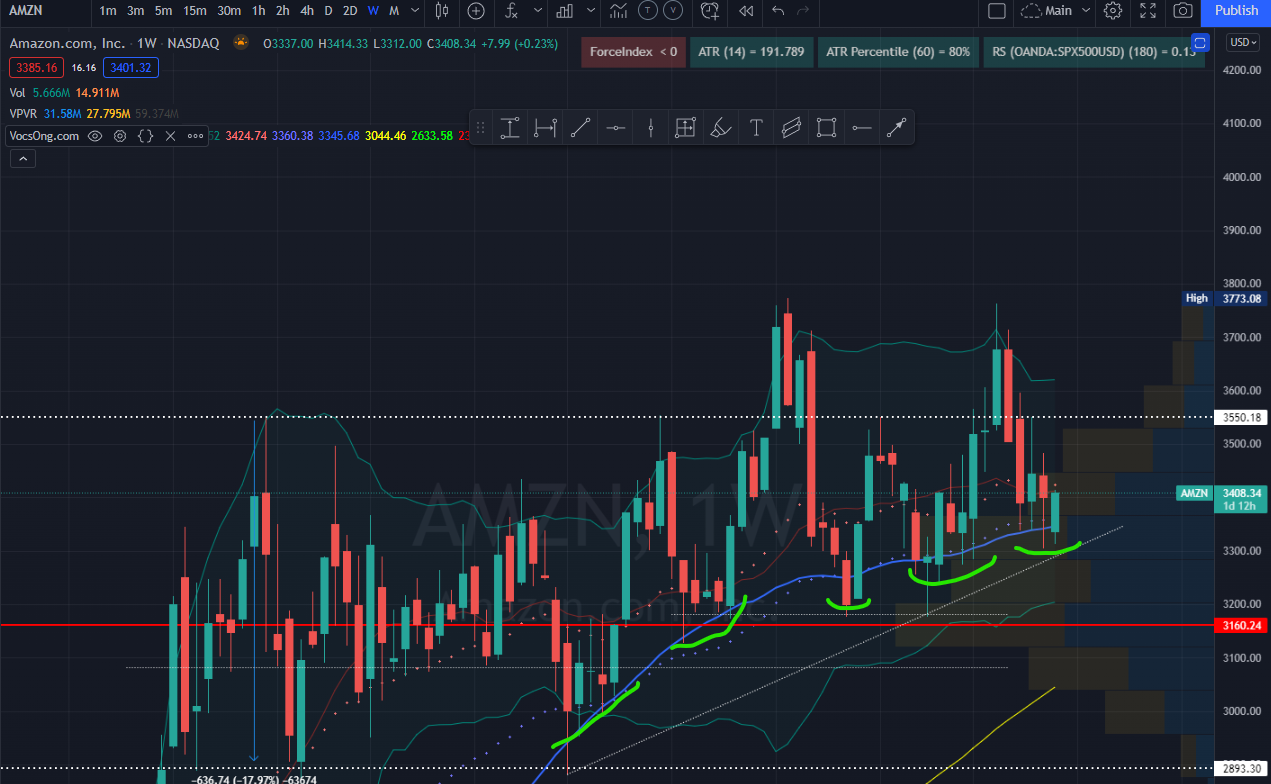
On the weekly chart of AMZN, we can see it's being supported by the 50 moving average in a nice pattern and currently it's sitting right on this support area around $3400.
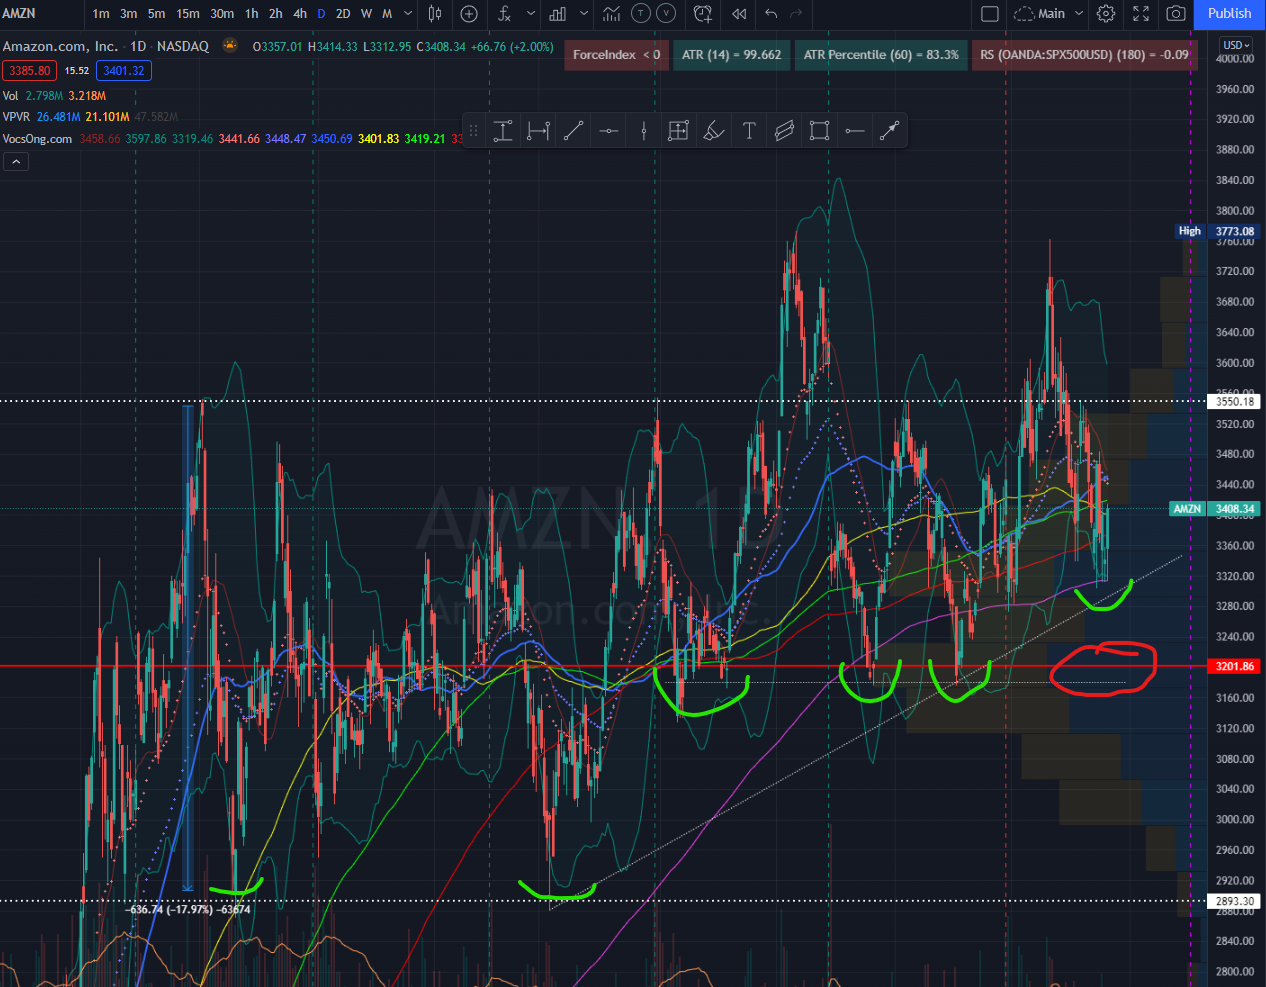
Let's go back to the daily chart. Although it's a little messy, we can still try to find some area of support. The red line (is actually a volume profile indicator, that I also use as one of the ways to find a support area) is around $3200. Which is identified as the next support area. And the next support area below will be $2900.
Option Chain Selection
Next we check the option chain for AMZN.
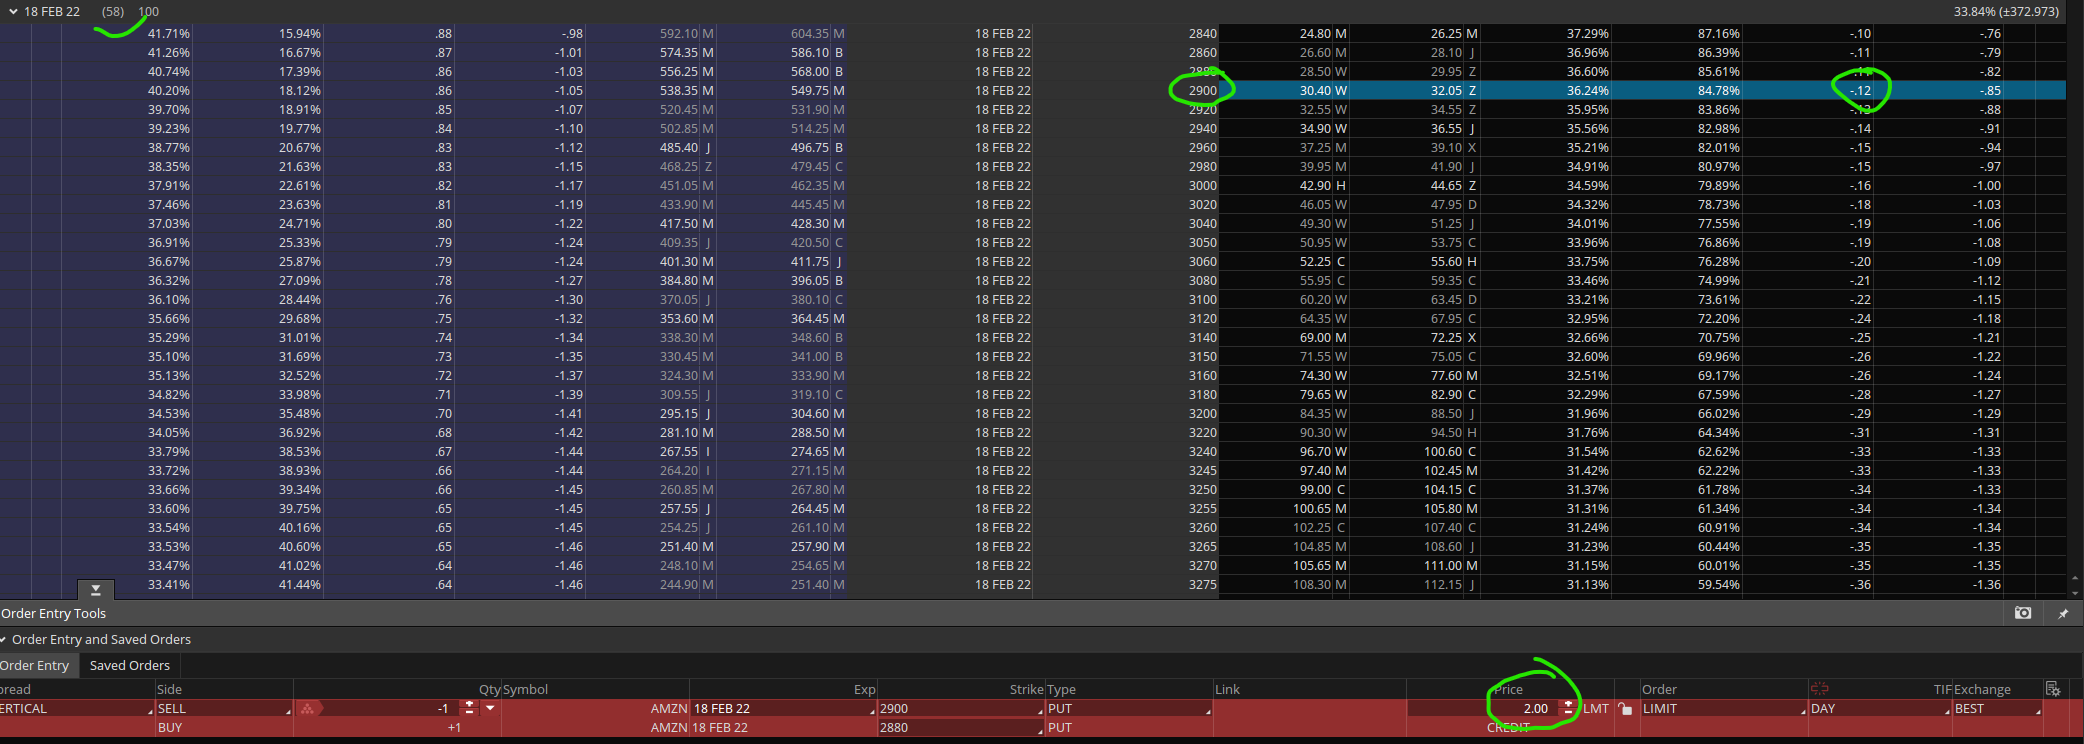
Go to the nearest to 60 DTE, which is 58 DTE for this example. From the chain we can see even at the $2900 strike, we also can get 10% risk reward target for a 20 wide spread.
For 20 wide spread
Risk is $20 x 100 = $2000
Credit is $2 x 100 = $200
Risk Reward = 200/2000 = 10%
So we fulfill the entry criterias:
- AMZN is currently at an identified support area.
- We got a strike 2 support areas away. It means we got 2 lines of defense.
- We get risk reward target within 10-12%.
Trade & Portfolio Sizing
Note that the above example is a 20 wide spread, meaning the minimum risk sizing is $2000. If your trade sizing is below this, you'll have to skip such spread trades. I'll cover more on trade sizing below. Just keep in mind for a bit.
Not only do we want to look at how to size the trade, we also want to take care of the entire portfolio sizing as well. Let's start with portfolio sizing first. I did cover that topic on another post, so it's a bit of a recap.
When we trade options, especially on selling options, we use margin to trade. A good guideline is to only trade up to 40% of your NLV. Meaning if you have $10,000 NLV, only use $4000 of your margin to trade. And for that it's meant for ALL trades, all your trade positions added together should not exceed more than 40% of NLV.
Then for trade size, let's use a 5 wide spread for example with the above $10,000 NLV. A 5 wide spread is risking $500 per contract. This means that you can only have 8 positions of 1 contract on, which sums up to $4000 risk. We try to keep the total number of positions we have near 10 because we don't want to hold too many positions concurrently. It will be hard to manage and cause huge drawdowns when the market goes on a correction.
So if you have a $100,000 NLV account, $40,000 is max trading allocation. We are going to have 10 positions at most, so each trade would be around $4,000 risk. Then we size up our 5 wide spreads by 8 quantities. Since each 5 wide spread is $500, having 8 quantities means $4,000 risk. Hope that gives a better idea on sizing.
Trade Management
In terms of trade management, we set a fixed take profit and stop loss percentage.
Take Profit: 60%
Stop Loss: 300%
Means when we reach 60% profit or 300% stoploss we exit the trade. To put this into better context for understanding, for a 5 wide spread trade. Let's say we get $0.50 credit. 60% target profit means we want to close it at $0.2.
We sell at $0.5
We buy back at $0.2
We profit $0.3
0.3 / 0.5 = 60%
For a stop loss of 300%, means we exit if it goes to $2.
We sell at $0.5
We buy back at $2
We lose $1.5
1.5 / 0.5 = 300%
So this can be also done automatically on the broker. For me I'm using Interactive Broker to trade, simply go to Configuration > Trade Settings > Combos and set the following.
Target Order (Profit Taker): Offset 60%
Attached Stop Order: Stop Limit Offset -300%, -330%
So when I enter a trade, a bracket order will be attached with the take profit and stop loss order. Once it's filled, I will leave it until it hits either of the one-cancel-one (OCO) order.
Special Handling
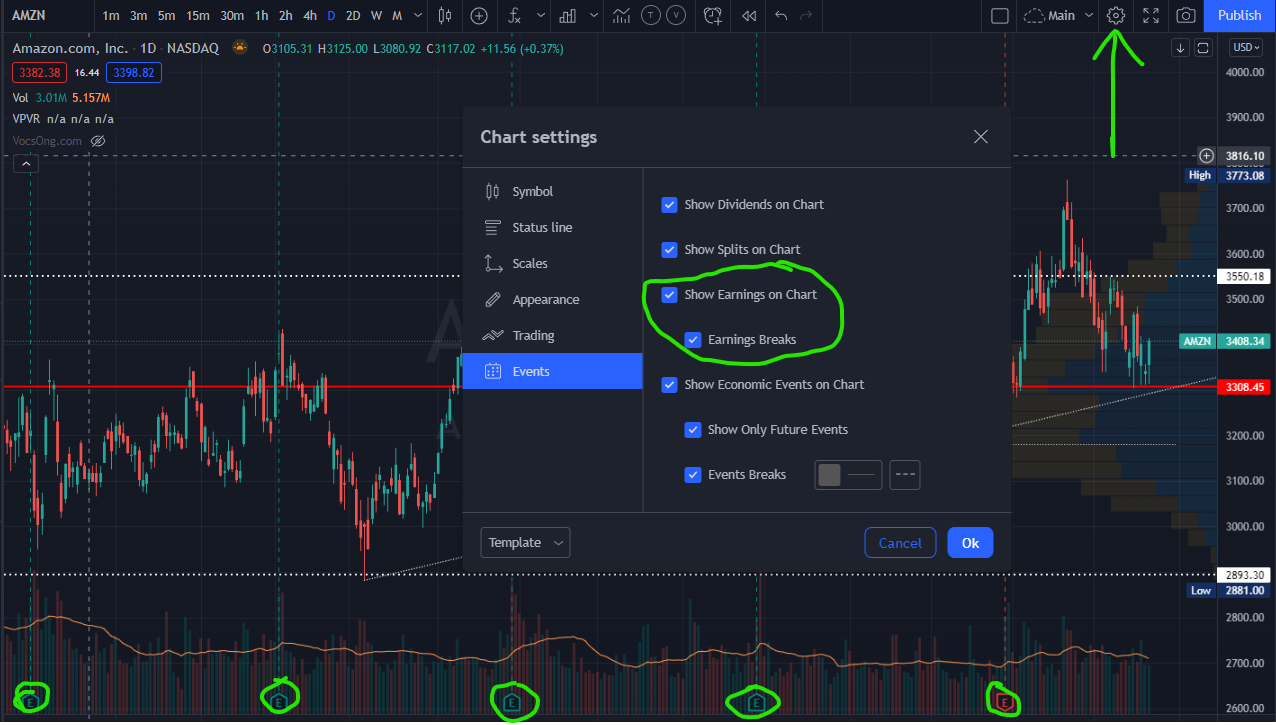
If the stock is approaching earnings, exit the position. Do NOT hold the trade through earnings. This is because earnings can cause huge gap drops to the stocks and this will cause you to lose more than the calculated 300%. This will lead to inconsistency to the strategy, so do keep a check on the earnings of those positions you hold and exit them when you see earnings is coming.
On TradingView, you can configure to see earnings in the settings.
One last thing to take note of is entry diversity. Try to not enter all your trades within a day or enter too many trades within a small period of time. Ideally, you want to spread it across the days as much as possible. For example every 1-3 days enter 1 trade. At some point you will reach near max position, then stop entering trades until there's position closed. This diversity prevents all your trades from taking the same drawdown during a market correction. There's no need to urgently fill trade to max out the position.
Trade with logic, less emotions.
If there's any questions do feel free to reach me here. If there's any further tweaks to this strategy I will edit this post, do subscribe for more updates.


Member discussion