Exploration on VicIF

Ok recently I'm doing quite alot of exploration, backtest and discussions around this VicIF strategy. So I just want to throw a post on this, gather all the information thus far. It's probably gonna be a messy post with all sorts of data, afterall this is what exploration is all about. It's not complete yet, just want to chunk down what we've got so far. See if things can have better clarity or maybe get more people interested to join in the exploration.
Background
Let's start with some background story. So it started in a discussion in Speaking Greek discord, and @aquavic shared one of his strategy he did occasionally. Which involves starting with an 5-wide IC (put credit spread + call credit spread) which targets at $1 per spread credit. So it created quite some interest among few people and this discussion went on pretty heavily it spin into a thread by itself.
So after having that 5-wide IC up, the idea is to sell the opposite side 5-wide spread when the side is tested. So for example if the put side is 'tested', we sell a 5-wide call spread at $2.5 credit, hence forming an IronFly that is pretty much very near the money (ATM) of the tested side. I quote 'tested' because there are still some variation, currently we've been testing if SPX price tested the short leg 0 - 5pts.
I might not explain it well, @aquavic has some pretty good guide on his VicIF here:
He also made a google sheet simulator to this strategy:

Hope that kinda covers the background and context, if you still don't get it. Hop into discord and join the discussion.
Backtest
So we did a bunch of backtest with OptionOmega.
As time goes, OO has been adding lotsa advance features that can help make such complex backtest possible. IMO, backtest is so important and money saving. You can test all you want without using your real money, at least to see data on whether the strategy works or not and make many tweak revision. Anyway this post is not about promoting OO, save that for another day.
For a start, we start with selling 5-wide put spread and call spread. Then set a stoploss exit condition for when the short strike is tested.
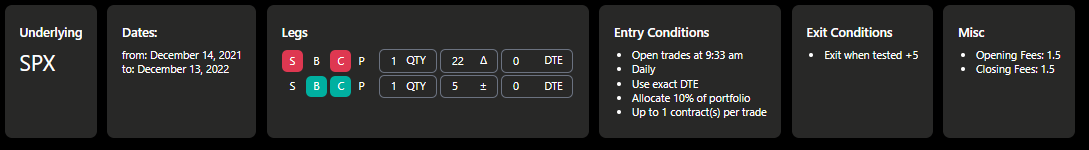
Few things to note on the settings:
- 22 delta because that's what we found to be able to get $1 credit on the 5-wide on average.
- fixed at 1 contract per trade as we are only interested in the win rate, to identify how often does it get stopped.
- exit condition is when tested +5 means when SPX price goes 5pts near our short strike it will exit, this is to simulate 'when' do we add the opposite 5-wide to make it an IronFly. We call it "IF Conversion". (the data below is using 0pts instead of 5pts, this screenshot is taken for other subsequent test)
- Note it's only testing 1 year of data because we find 2yrs or more data gets more inconsistent as credit target might not be the same due to a totally different environment. This is also partially because we couldn't do credit on spread targeting on OO, hope they improve this some day.
Then of course we also have the put spread separately as another backtest and put both of them into OO's portfolio test. Which looks like this:
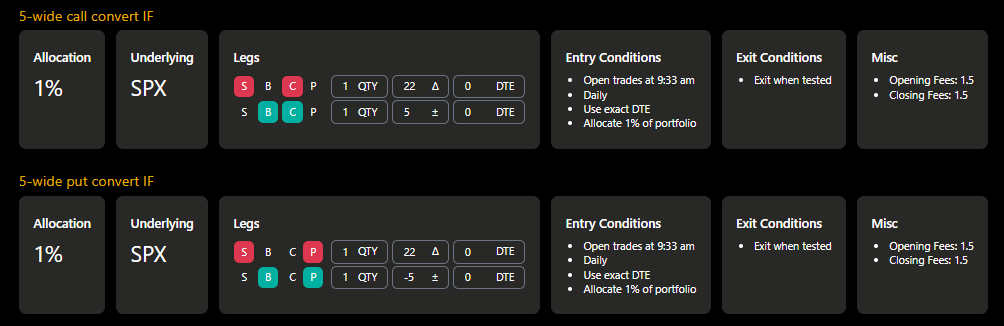
Note the screenshot has a different exit condition because we're still testing different 'tested' scenarios to find balance.
At this point, we have the data for this "exit when tested" simulated VicIF statistics. There's few important area of stats to put together, namely:
- IC Win - how many days both side win
- IF Conversion - how many IF was converted (Tested)
- IF Pinned - how often does SPX expire within the IF
- IF Pinned distance - whenever SPX expire within IF, how near is it to the center of IF
- Double Loss - how often does both side gets converted to IF (we assume double loss for this)
Yea there's alot of scenario and data category, so I pulled up PowerBI and throw the tradelogs data in and put together some numbers.
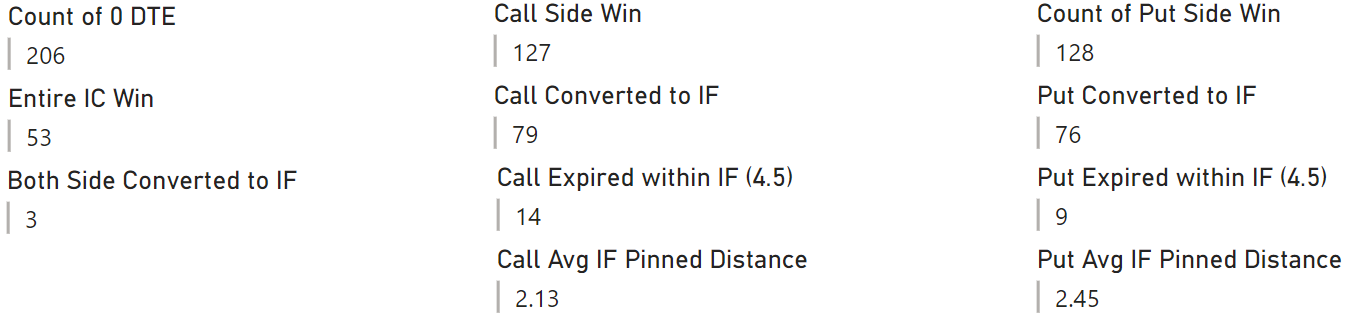
From these numbers, I try to calculate what's the annual profit/loss:
Entire IC Win at $1 each spread
53 * 2 = $106
Call Expired within IF * Call Avg IF Pinned Distance
14 * (5-2.13) = $40.18
Put Expired within IF * Put Avg IF Pinned Distance
9 * (5-2.45) = $22.95
Double Side Converted (Assume double loss)
3 * 3 = $9
Single Side Loss (Count of 0 DTE - Entire IC Win - Both Side Converted - IF Pinned)
206 - 53 - 3 - 14 - 9 = 127
127 * 0.5 = $63.5
Overall = ( 106 + 40.18 + 22.95 + (-9) + (-63.5) ) * 100 = $9,663 / Year = $805 / Month
Do note that these are simulated numbers for estimation purpose and understanding the categories of scenarios. It will help on understanding what and how to improve on later.
Advance Backtest
So what we're trying to get is not exactly the result of these backtests although we'd take reference later. The important part here is to get the tradelogs where we have the data on when does the stoploss trigger, which simulates when will the "IF conversion" happens.
Just to show how the tradelogs look like:
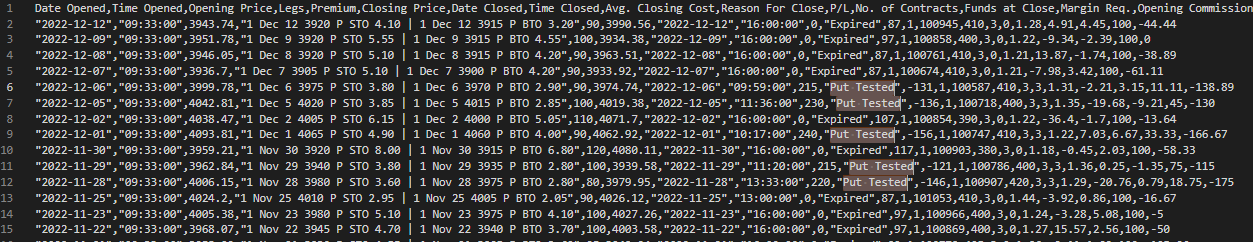
See that when the spread get tested, there's a state "Put Tested" or "Call Tested" to that trade. From here, we are going to do some even more advance OO way of backtest. Credit to @shortvol for sharing how to do this and OO for having such a feature released just few weeks ago.
So what we want to achieve is to convert that tradelogs into a custom signal entry and strike csv with all the original entries. Then add in the entry and strike for those "Tested" timing with the "IF Conversion" entries. To better simulate this VicIF strategy.
Converting this tradelogs to custom signal csv is pretty painful process currently, it involves manipulating the csv alot. I used google sheet and vscode to do this, thankfully I'm quite proficient on this and manage to get the custom signal csv out in a hour or so. I'm considering to write a python program to convert this though, lemmi think about it alittle more.
So now with the custom signal csv, we run the backtest with this advance mode:
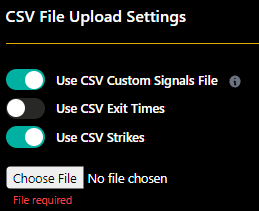
And this is what we get so far:
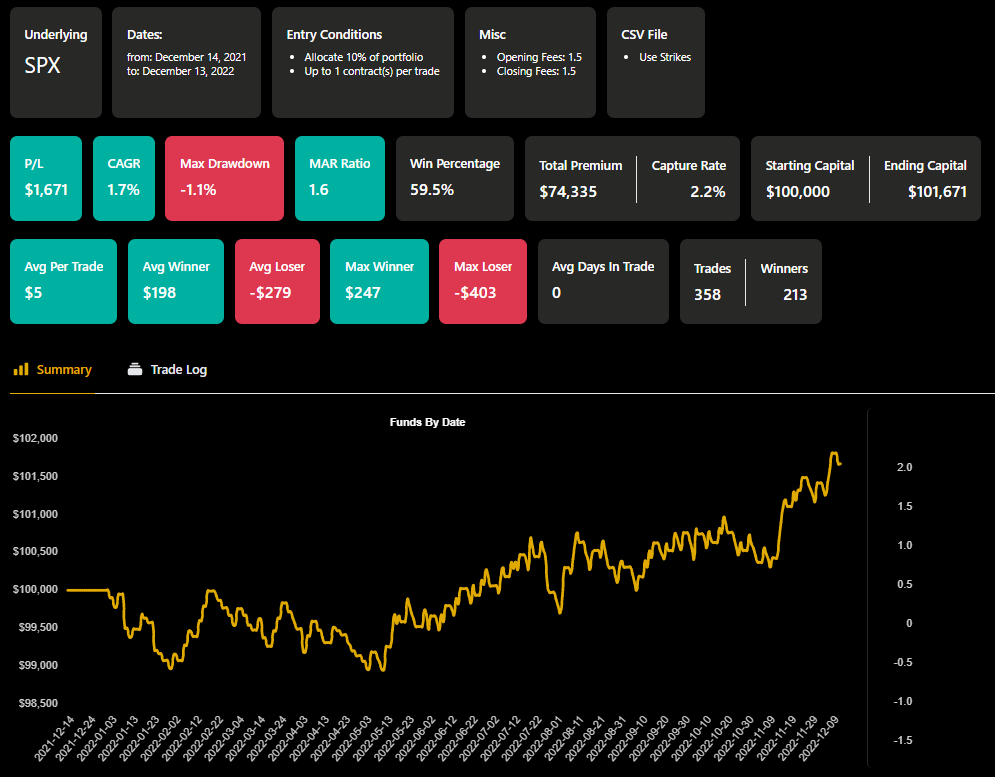
Going through the tradelogs of this backtest, @shortvol actually found that the IF conversion is not getting the ideal target credit we expect for the strategy. As per VicIF trade plan, we want to target $2.5 credit for the IF conversion. But from the backtest tradelogs, we're seeing alot of $2-2.2 fills on that IF conversion causing quite some drag.
To reference to above statistics, this is affecting the single side loss where we're expecting $0.5 loss per single side loss. But because of the IF conversion only getting $2 instead of $2.5, we're losing $1 per side.
Expectation
127 * 0.5 = $63.5
Backtest
127 * 1 = $127
We can see this itself is causing huge portion of drag. And to relate, this is because we are running the exit condition on 'When tested" without any offset. Meaning when SPX touches our short strike, it exits.
So that's our 'current' state of exploration so far.
Next Steps
Some obvious next steps is to re-run the entire test in +10 offset when tested on the exit condition. This would cause some shift in the stats we have:
- more IF conversion = more single side loss
- more credit on IF conversion
- more IF Pinned (since there's more IF conversion, we expect more Pin)
- less IC Win
- more double loss
But since we know the single side loss credit has such a huge drag, trying to balance it will create a much better balance and consistency across all the numbers.
Some even more complex and advance stuff I'm thinking includes:
- Entering 2-3 tranche per day, this increases the coverage of IF for each day.
- Tranche would also lead to entry timing, instead of 933, are there other better timings trends or pattern.
- See how to run the test on 2021, because from the many runs we see 2021 is a pretty bad year for this strategy despite the bull market. If we can get this strategy to show consistency in 2021, it might be some good data points to know.
I know its probably a long and messy post but I think it's good to journal down these. Good to reference back, visualise and clear thoughts. If you're interested, find us on discord.
Bonus mention, @Al Dabby is playing with a 10-wide version of this.


Member discussion