Iron Condor Credit Target Backtest 2

This is somewhat a part 2 of the previous post:
 Vocs Ong
Objective
But this time I'm also adding a AM/PM perspective to it. So in this series there's 2 things I have in mind to clarify.
- AM vs PM
- Credit $0.9 / $1.2 / $1.5
They are not independent, it's more of the matrix I wanna figure out. e.g. does lower credit do better in AM/PM. There will be 10 x AM tranches from 9:32AM to 11:45AM and 9 x PM tranches from 1:15PM to 3:15PM. Intentionally avoiding 12PM range as that have been worse performing for almost every other test.
AM Timings
Open trades at 9:32 AM, 9:45 AM, 10:00 AM, 10:15 AM, 10:30 AM, 10:45 AM, 11:00 AM, 11:15 AM, 11:30 AM, 11:45 AM
PM Timings
Open trades at 1:15 PM, 1:30 PM, 1:45 PM, 2:00 PM, 2:15 PM, 2:30 PM, 2:45 PM, 3:00 PM, 3:15 PM
Setup
With that in mind, let's set some base configuration.
- it will be 2023 YTD, just to get a more recent trend
- it will be 100% SL for this series (i tried many adhoc runs on different stoploss and decided to dig more into this)
Here's a sample Put Spread configuration on OO:
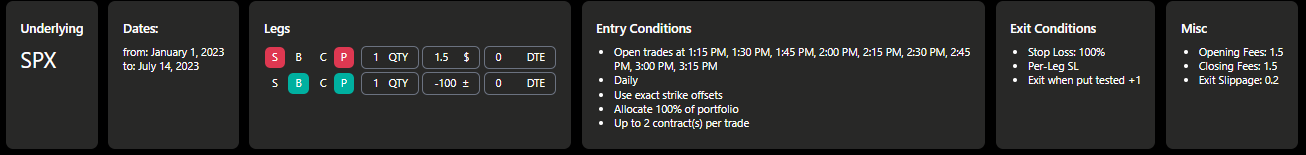
Expectation
Just to set what to expect from the results, I want to see relative performance comparison and not the absolute numbers. The numbers for each test don't make any value, it's the relativity results I'm interested in.
Would be more or less comparing CAGR, MAR, PCR to find a pattern out of it
Test Results
I'm not gonna paste every OO screenshot here, it's gonna flood the post. Here's the summarised table. Just reminder that this is 2023 YTD test.
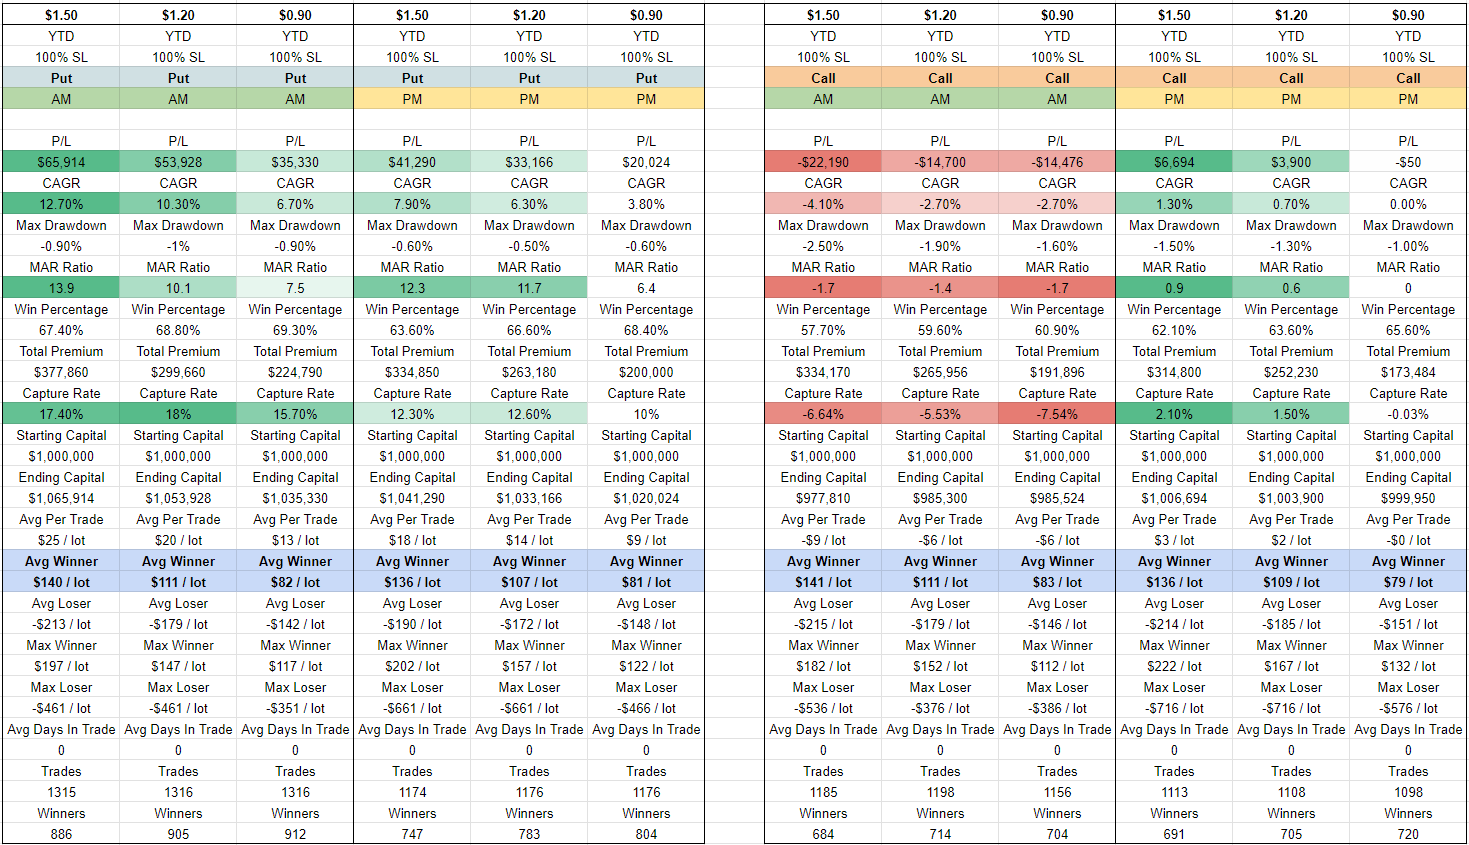
Take Away
Just from observing the summarised table:
- Higher credit perform better than lower credit, except for AM calls
- AM Puts perform better than PM Puts
- PM Calls perform better than AM Calls
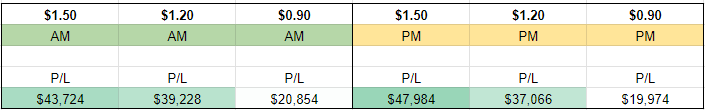
On the combined results, we still see a similar observation on a simpler pattern. Despite AM calls not doing as well, AM and PM combined results still end up pretty comparable.
This tells me I should continue to evenly distribute my tranche across the day. I should lean higher credit for better returns.
One thing that I'm fully aware of is the slippage simulated in this backtest is only $0.2. In my own real trades I'm getting $0.1+ average slippage while doing $0.7-$1.1 average credit. So using $0.2 I'm already giving some slight buffer. I did tried using $0.3 and it took up quite abit of returns from the above results. This tells me keeping average slippage low is quite important too.
I'll be trading $1.4 avg credit for awhile now after these series of test and referencing tests done by others.


Member discussion