Market Analysis - 3 Dec 2021

Just to pen down some of my personal analysis and thought process on what I think the market will be like today and possibly the next couple of trading days. Just to keep it simple, what I'll be covering is mainly on the overall market perspective which mainly focuses on SPX.
Just to craft out the flow of what I'm going to go through.
- SPX 1 Minute Candle Chart - To understand what's happening in the past 1-2 days
- SPX 30 Minutes Candle Chart - To see some internals of the past 1-2 weeks
- SPX Daily Candle Chart - To look at a broader picture
- Economic Events - To get a sense of what could be a catalyst
- Conclusion
SPX 1 Minute Candle Chart
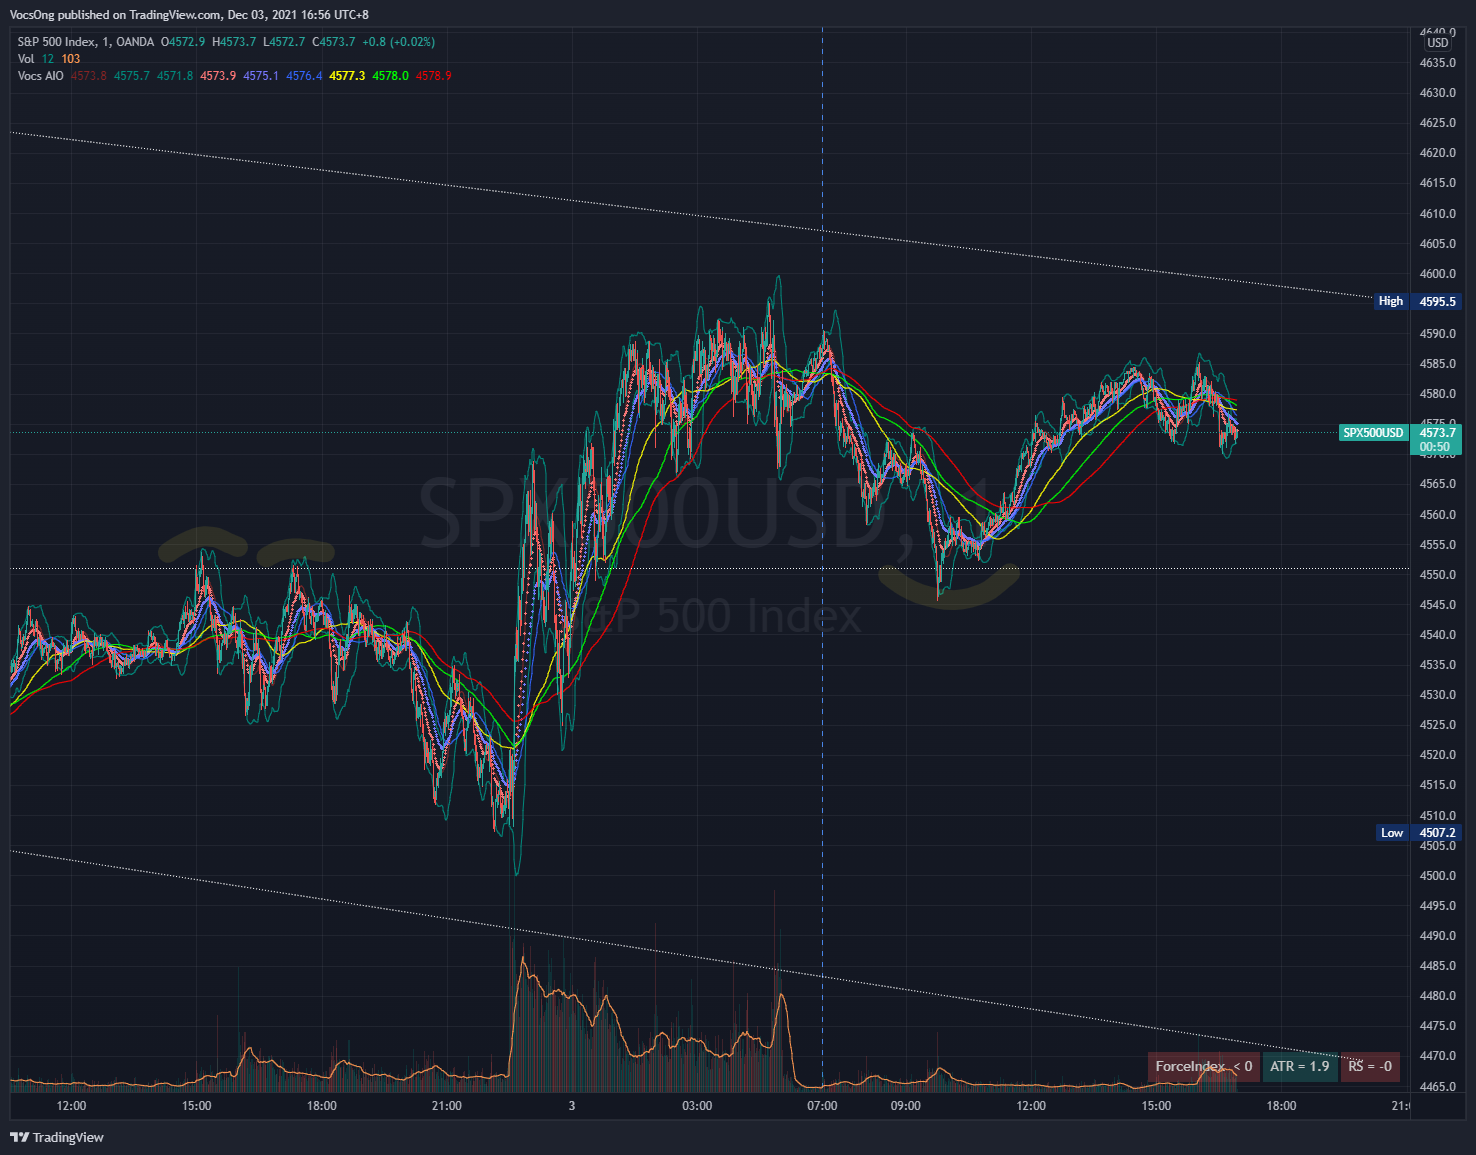
From the 1 minute chart, we can see yesterday there's a double top hitting a long term resistance line that was drawn all the way from Sept 21. You will see this later in the daily candle chart. SPX subsequently broke upwards leading to a slightly bullish close for yesterday. Today outside regular trading hours, SPX actually retested this same resistance line as support. A little take away here, SPX is reducing it's range of movement after a few days of big moves.
SPX 30 Minutes Candle Chart
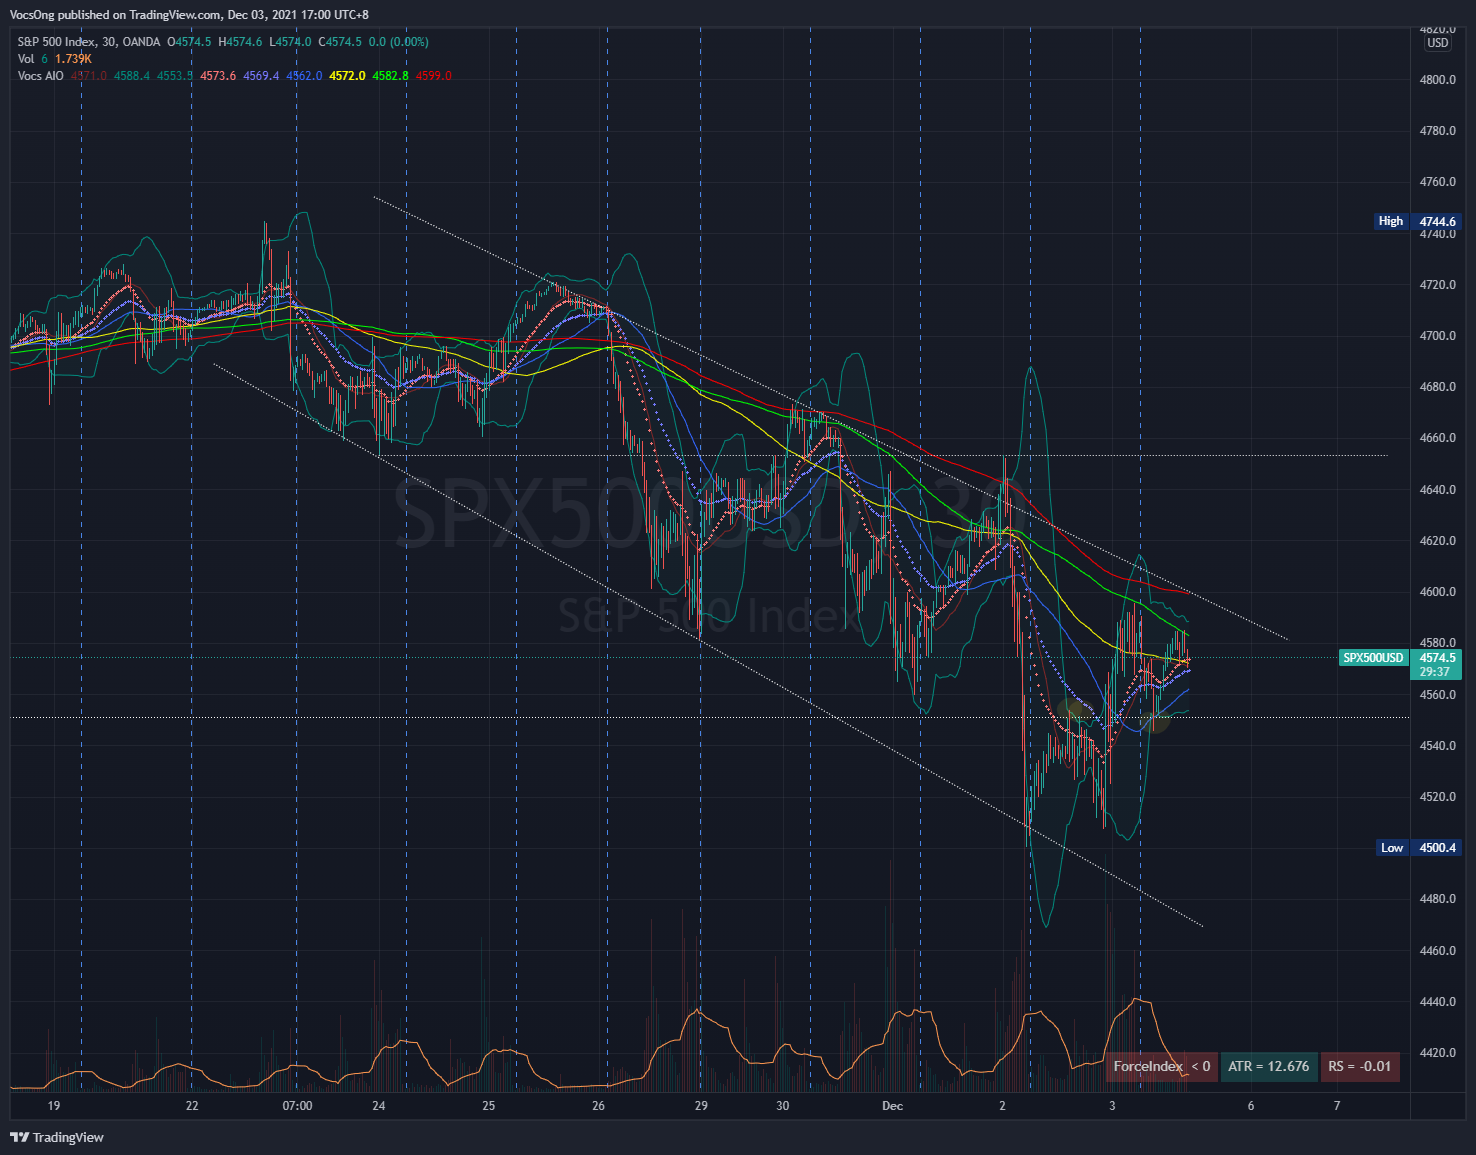
This is where it gets a very nice view of a downtrend channel. That's why it's important to check the different timeframes and do some charting to see if we can find more information on the price action. Here there's also a little take away, we would expect SPX to either break upwards or downwards of the channel. Definitely can go both ways, we wouldn't know the future. What we could keep in mind is if it breaks either of this, we should watch out for a trend change.
SPX Daily Candle Chart
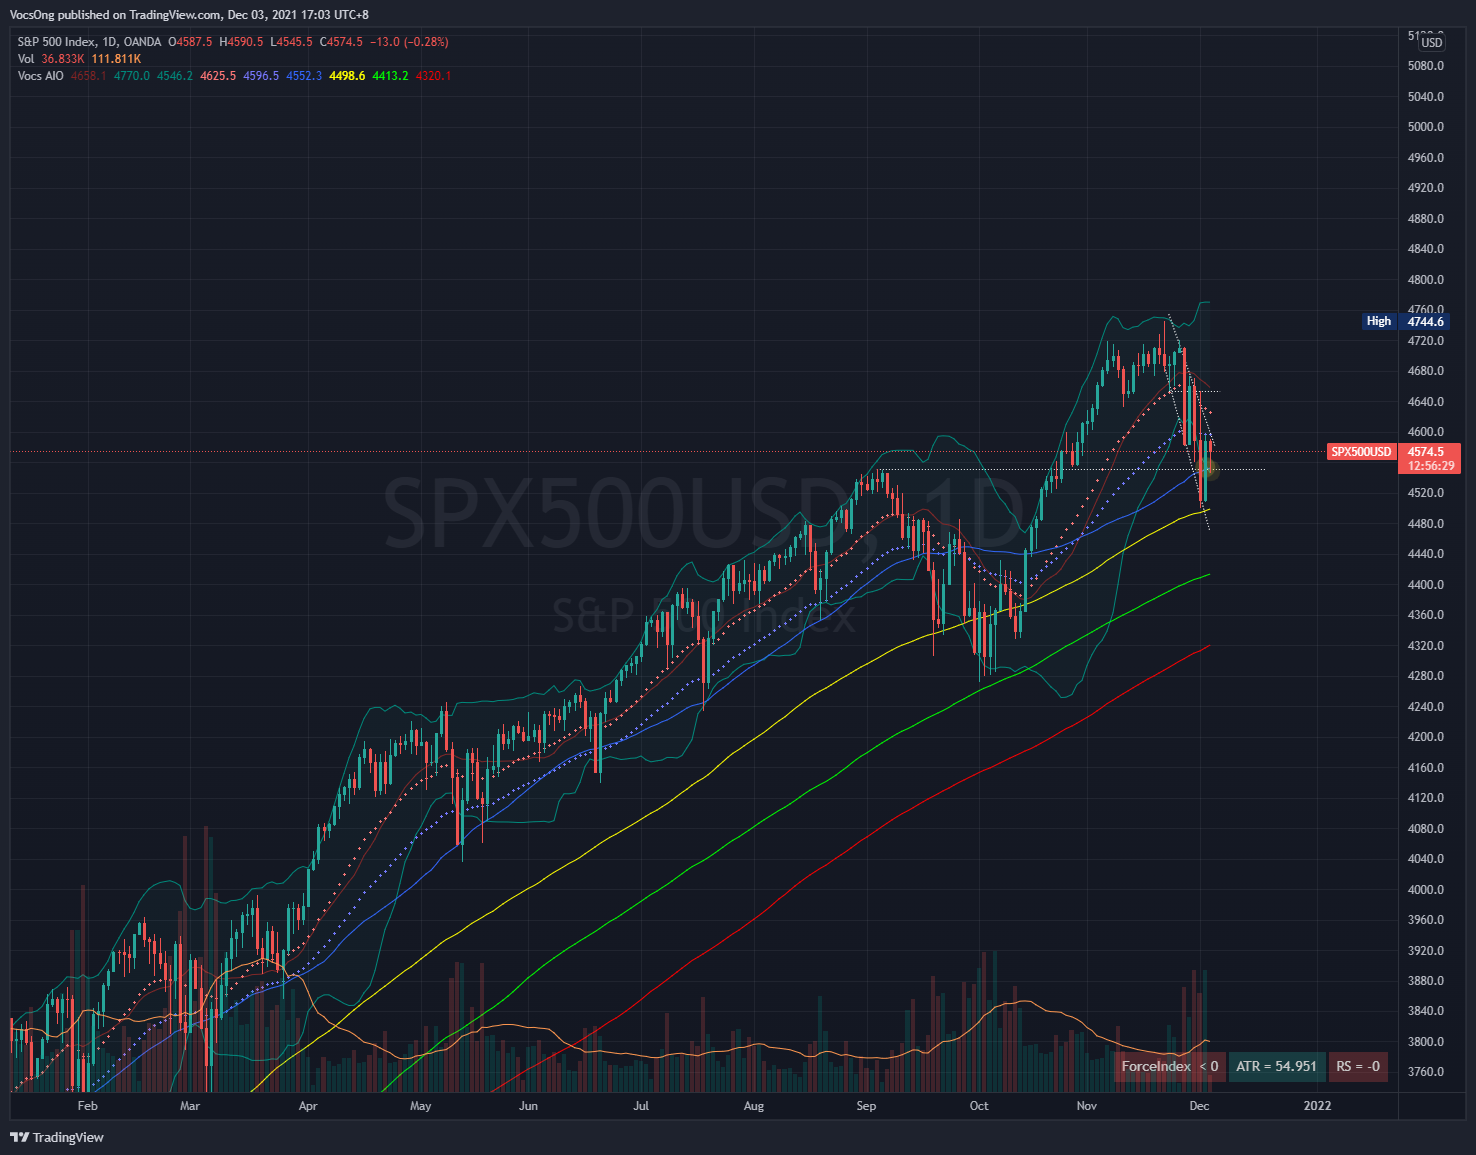
Here we can see the resistance line I mentioned earlier that back dates all the way to Sept 2021. It's interesting to see that a trendline so far back is getting tested in the 1 minute chart. So from the daily candle chart, we still see a decent uptrend and currently SPX seems to be dipping the 50 moving average. It could potentially dip a little more to 100 moving average since it's pretty near. Similarly, it can go both ways, we wouldn't know. What we can do is to put as much information together to be ready when it moves, or at least not get too surprised.
Economic Calendar
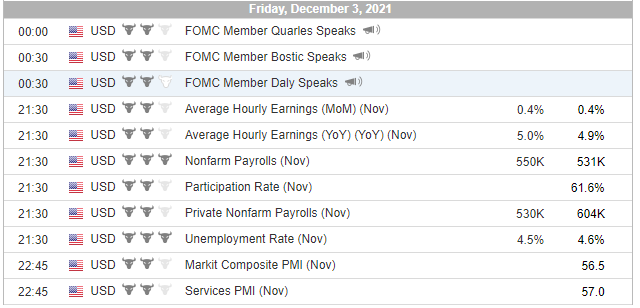
This is what are the key events happening today that might have some impact on the market movement. That's also why I added a convenient access to the economic calendar on this site.
So the key events are around Nonfarm Payrolls and Unemployment Rate. The result of these, will definitely bring in many analyst perspectives of how the market will be together with the very recent omicron variant. I usually don't analyse what the numbers will be or what the analyst is gonna say that will lead the market going which direction because it often can also happen the other way. I would rather take it simply as an event that will cause the market to move more, with an increased volatility.
Conclusion
So with all the above information, pretty much today's economic event should determine we break upwards from the channel in the 30 minute chart and have a good December run. Or we break downwards to 100 moving average on the daily chart.
For me, I kind of lean towards a 30 minute chart breaking upwards and daily dipping 50 moving average. Mainly from the technical analysis and charting perspective. I do not have a crystal ball, I'm just putting information together to predict what could happen, pretty much some concept of futurology.
Not sure if that helps in any way, I just wanna share my views. If you think you have a different view or you have more information that you think I should also consider, feel free to email me.


Member discussion