Technical Credit Spread Advance Backtest

As I get more and more complex into these advance backtest, sometimes I also find it hard to write it down. I'll try my best. Got feedback from @tbaloch in discord maybe I could write it more like a guide on how I do these test step by step. So gonna try that, some parts may be too technical for many though.
Context
To set some context before we get going, there's really alot going on in these technical OO backtests. I've done so many test that I've come to a certain technical entry condition, so stick with the ones I'm using for this post.
Here's the technical entry conditions.
Uptrend Entries (Put Credit Spread)
- Trend following - 10 ema above 50 ema AND current 1 minute candle CLOSE LOWER than previous 2 minute candle LOW
- Trend reversal - stochastic-k (30,3,3) less than 20 AND current 1 minute candle CLOSE LOWER than previous 2 minute candle LOW
Downtrend Entries (Call Credit Spread)
- Trend following - 50 ema above 10 ema AND current 1 minute candle CLOSE HIGHER than previous 2 minute candle HIGH
- Trend reversal - stochastic-k (30,3,3) more than 80, STOP ENTERING
Ok these conditions itself seems like there's gonna be some obvious questions. Lemmi try to touch on them, there's no typo there.
Q1) Bullish entry on Red Candle?
Yes, you're seeing uptrend entry on red candle and downtrend entry on green candle. Many would think by default how we learn technical analysis that a green candle pattern might be the trigger to go bullish entry. But I've tested many permutation and somehow accidentally tried the inverse which then accidentally found this actually performed better.
My own explanation to this after seeing many different test consistently perform better is especially on the put side is, when we enter on red candles it's when IV had that slight increase and option price goes up. And when we're trending, these entries acts as slightly early entry on this little dips. Over a longer period of statistics, it will turn out better.
Q2) Stop Entering Call on Overbought
So the condition on call side is slightly different, instead of doing overbought enter call we actually STOP entering. This is also another accidental find along the many tests, in some test I forgot to put in call side reversal and saw a better results. Then I ran many more similar comparison to realise not entering call when overbought actually turn out better.
My own explanation to this is mainly on 2 basis. One is uptrend continuation more often than reversal. Two is related to the IV effect above as well, when we're overbought IV shrink option price shrink hence we often not get a good credit entry. In comparison the put side often benefit from this. This is also related to the put call skew we often see.
Q3) My way of trading
Not so much a question but to explain how some of these 'STOP ENTERING' work. So how this trade simulate is within a day there will be 10 entry times scheduled. At each entry time, both put and call side will start trying to find condition to fulfill then enter. This 'trying to find' continues until either an entry is done or 'STOP ENTERING' is flagged. By the next tranche timing, if the previous timing had no condition filled for either/both side, the next tranche timing will reset both sides and start trying both sides again. Not sure if it's confusing to follow.
E.g. 10:30 and 11:00 are 2 of the scheduled times.
At 10:30, it will start trying both put and call condition to see if any matches to submit an entry. Usually the trend following side will enter first as it's easier to pass the existing condition of fast ema above/below slow ema and candles. Say 10:35 its uptrend and Put side entered, put side will now stop trying to enter since it's entered. Call side will continue checking each minute to see if the condition pass. Let's say until 11:00, there's no call side entry. The 11:00 tranche will reset both sides and both sides start trying again.
Setup
So now that you understood some of the confusing stuffs above, let's get into some basics. Easier to just show the backtest configs.
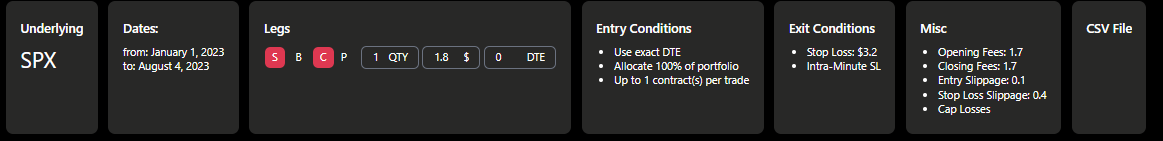
So I'll be running these for Call and Put separately. I'll also be generating the signal files for these entries using Python.
Basically means, I use python to check through those condition I write above and flag all the entries into a OptionOmega signal csv file to run this setup.
There will be 14 timing scheduled.
Objective
So what I'm gonna do in this post, have to come so long to start explaining this. What I want to find is which is the best fast EMA / slow EMA. So these are my permutations.

Means I will have 20 permutation. E.g. 5/40, 5/50, 5/60 ......... 30/80
How?
Let's go through some python codes.
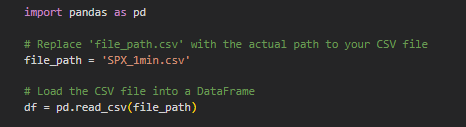
First I need to read in per minute SPX OHLC data so that I can do all those technical calculation and checks. The SPX_1min.csv includes 1min OHLC from Dec 2020 to 2 Aug 2023.
Regarding how I get this SPX OHLC data, it's another long technical approach. If anyone interested I'll write that separately.
This above code basically reads in the csv file into a pandas dataframe (df), if you don't know coding it's just a fanciful object that can help store all the data for easy use later.
The next part of the code is to calculate all the technical data and store them in that same df so we can compare them later.
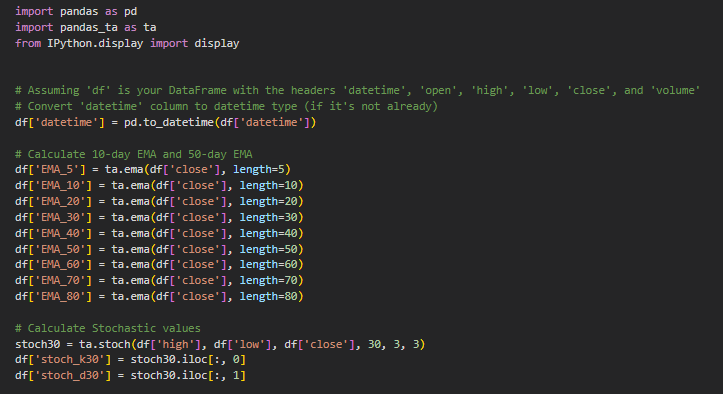
See how easy to just use the available library to process the calculation using pandas_ta.
Just a quick fyi, I'm going through ALL the codes I have not skipping any. And all these is in a jupytor notebook (.ipynb file) for easy run. You can find out more about jupytor notebook if you're learning python, it makes things so easy especially with chatGPT.
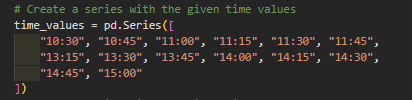
Before I run the actual loop through all the SPX minute data to check and flag when are the entries, these are the preparation values.
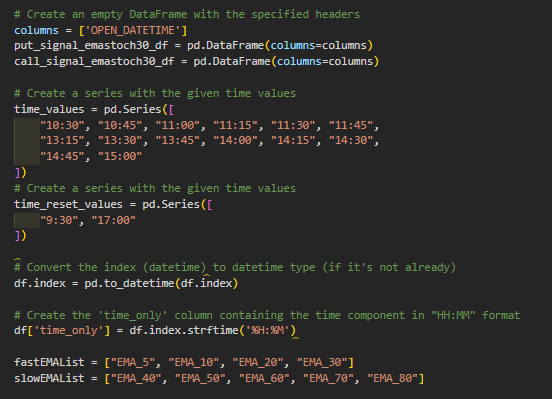
Basically setting up the timings, the EMA list and some other variable to be used.
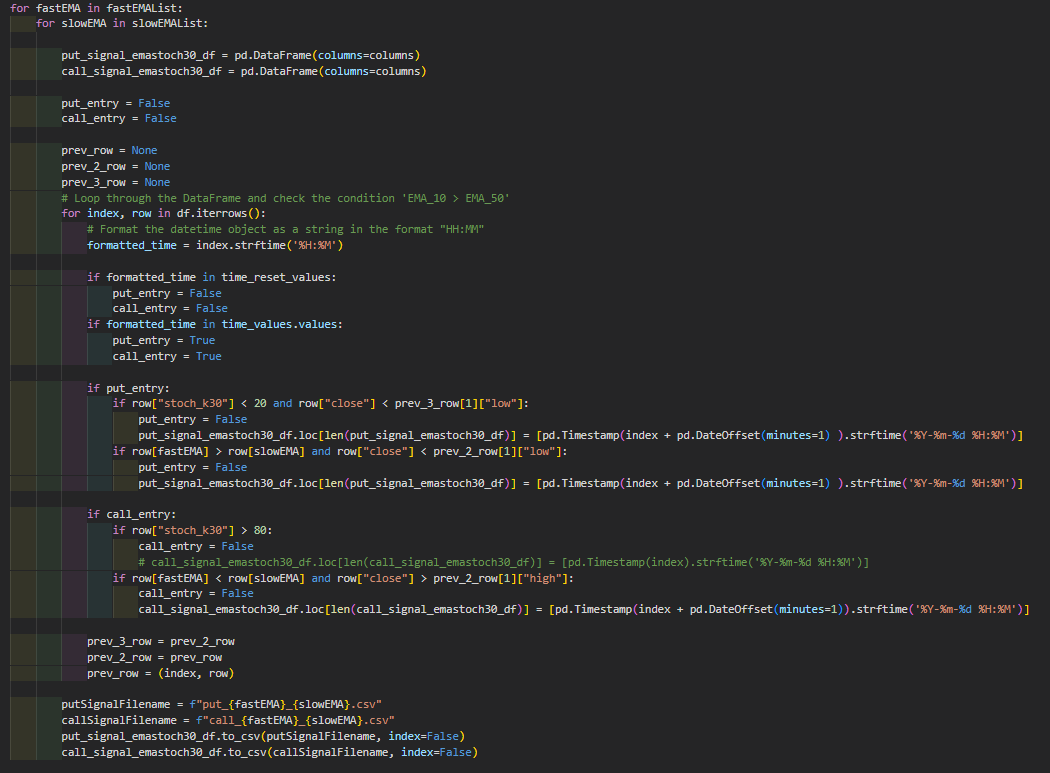
So as I mentioned in objective, I want to generate signal files for all the EMA permutation. So the first 2 nested loop are basically going through the permutation. For each permutation, it will run the entire SPX 1min data and check if the condition is met then add to another put/call signal df.
Then for each EMA permutation, it will generate the respective signal csv names. Since there's 20 permutation, there will be 40 files.
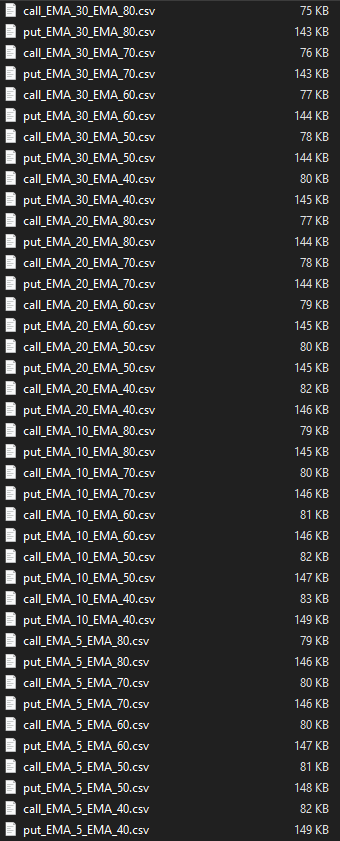
I'm giving this whole list of OptionOmega signal CSV as well.
So the next step is to run all these in OO. Since there's so many runs, I will prep them for easier management and faster run.
First I will save one run for put and call that's setup to the configurations I want.
At this dashboard, ctrl+click the put and call links several times to open many tabs of the same test.

In chrome browser, I grouped them into C and P groups as you can see above so it's easier to find them. C for all the call runs and P for all the put runs.
So now all the tabs will be of the same config, I only need to go through the tabs and change the csv files at the bottom then run it.
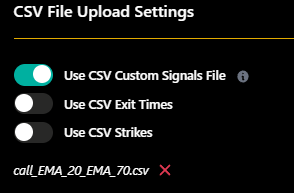
Repeat for all signal files. Use ctrl+tab to jump to the next tabs faster.
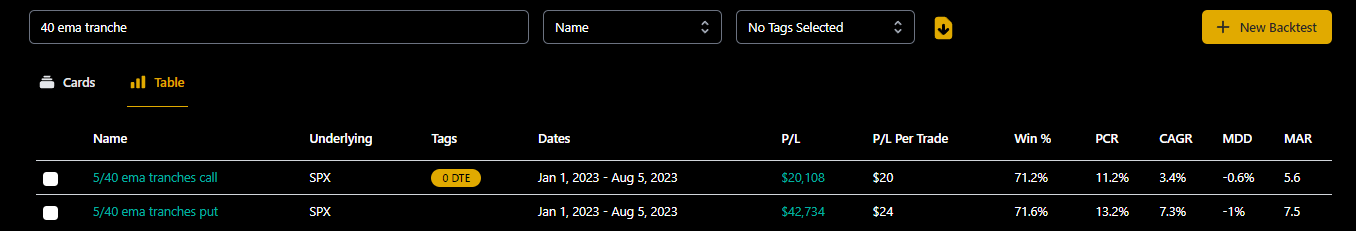
After each run, you'll see the result page like the one below.
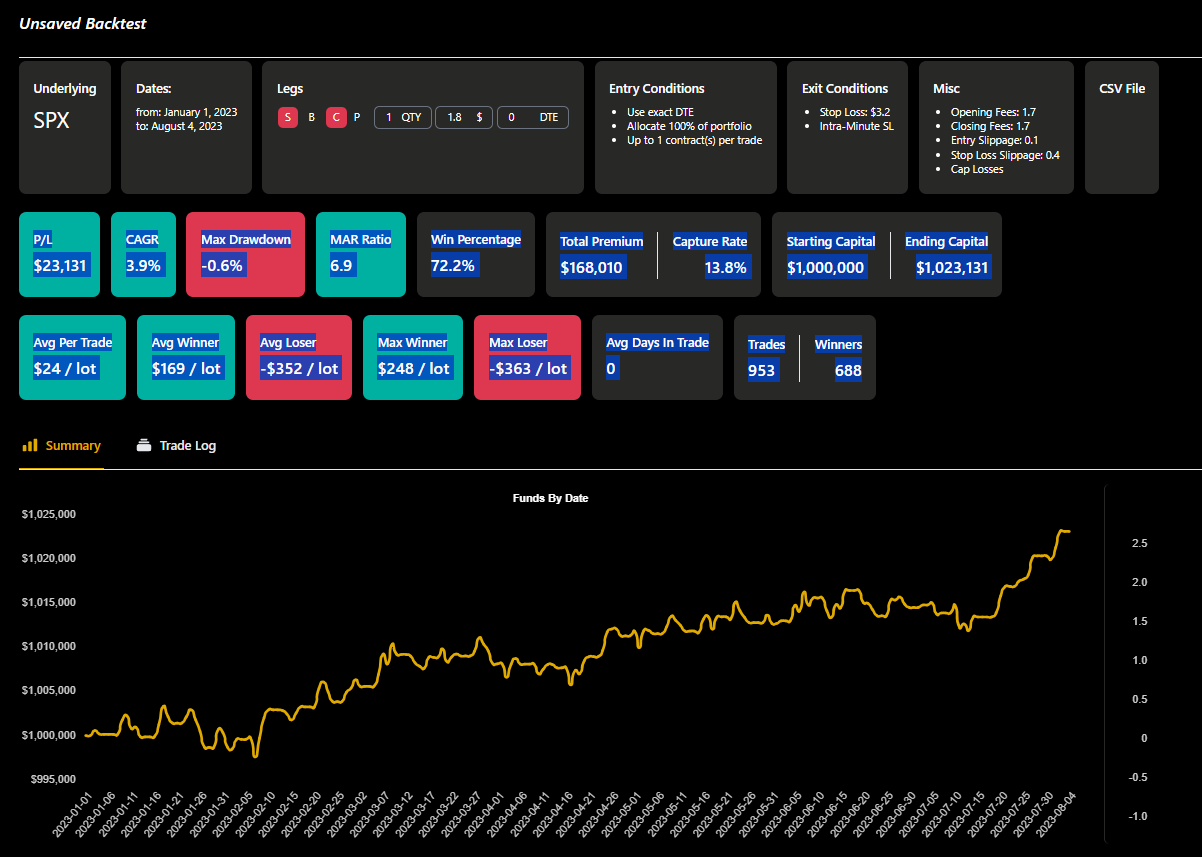
Drag from P/L all the way to Winners and highlight them like I did in the screenshot above.
This part is more of how I process them in google sheet efficiently or productively as I find saving in OO is kinda slow and not the way I want to visualise data.
Copy the highlighted text, go to google sheet and ctrl+shift+v. You will see it pasted this way.
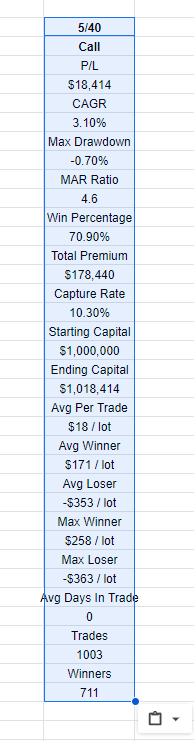
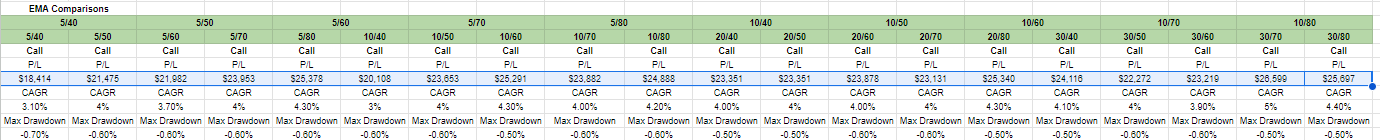
Repeat the same for all runs and organise these accordingly in google sheet. This is what I end up with.
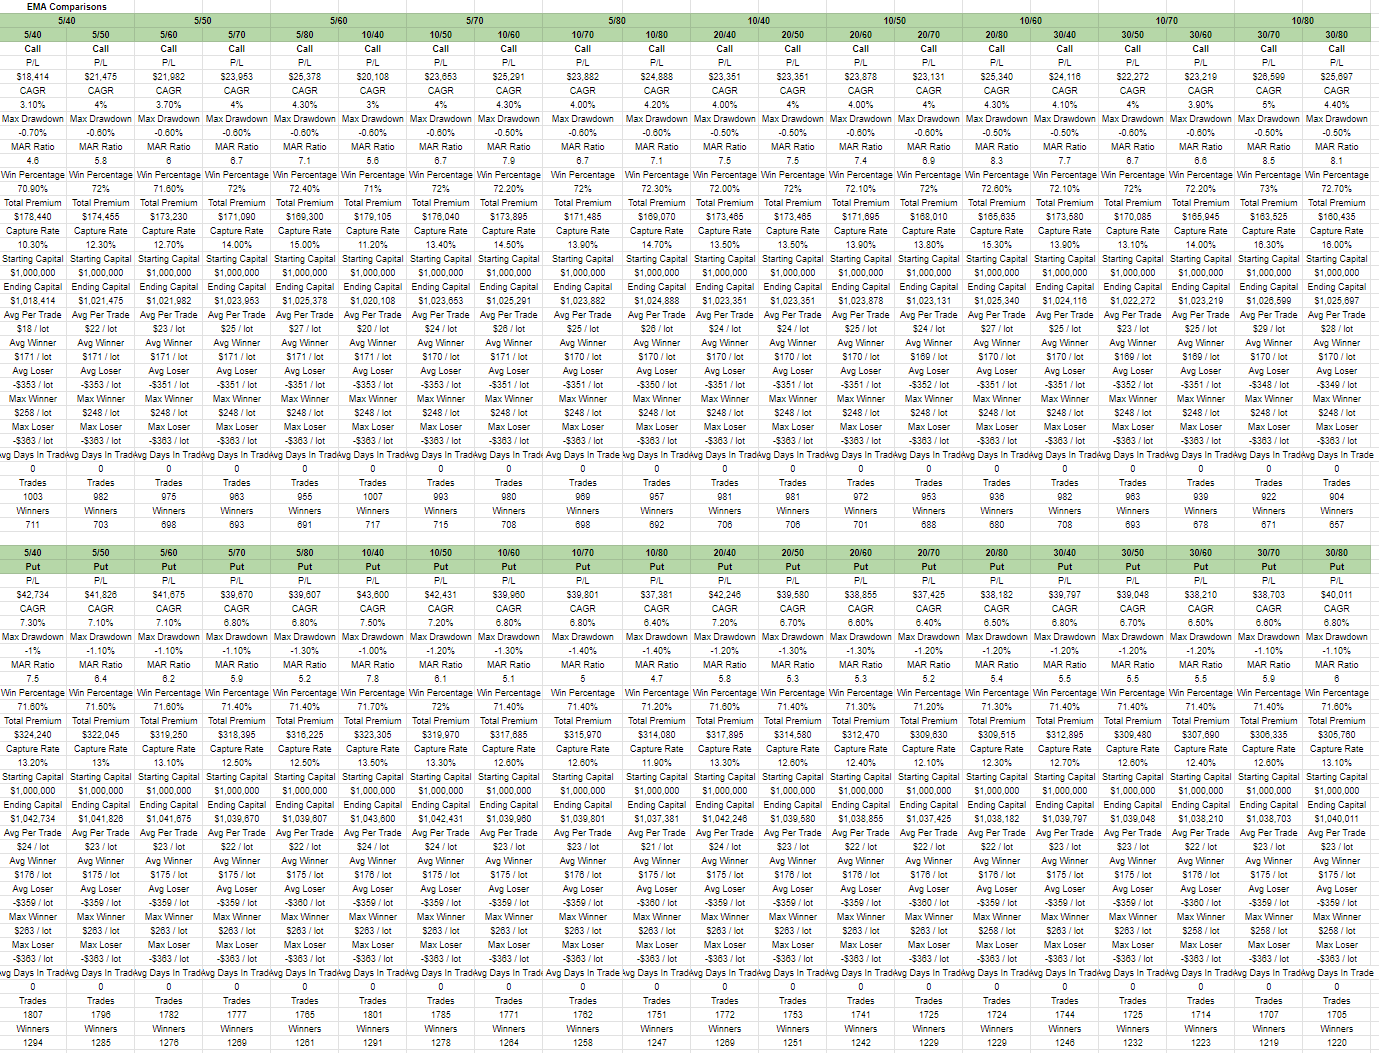
Yea that's hell alot of data on the screen but it's still not making sense yet. Some more processing required. Let me teach this part abit also.
In this case I'm only interested in few rows like P/L, CAGR, MAR, Capture Rate, Win Percentage, Trades.
Highlight and Copy a row.
Right click on some empty area > Paste special > Transpose.
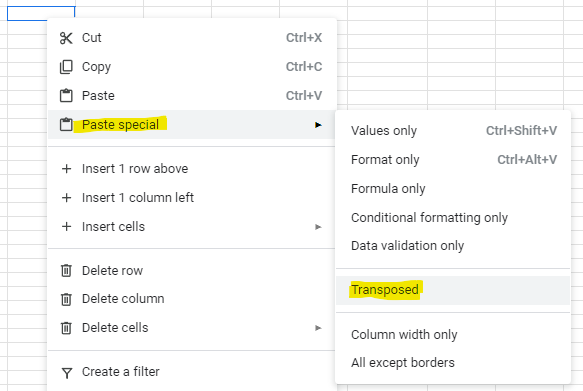
You will see now the data become rows.
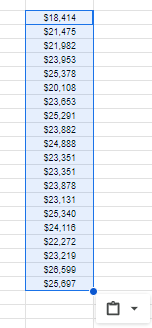
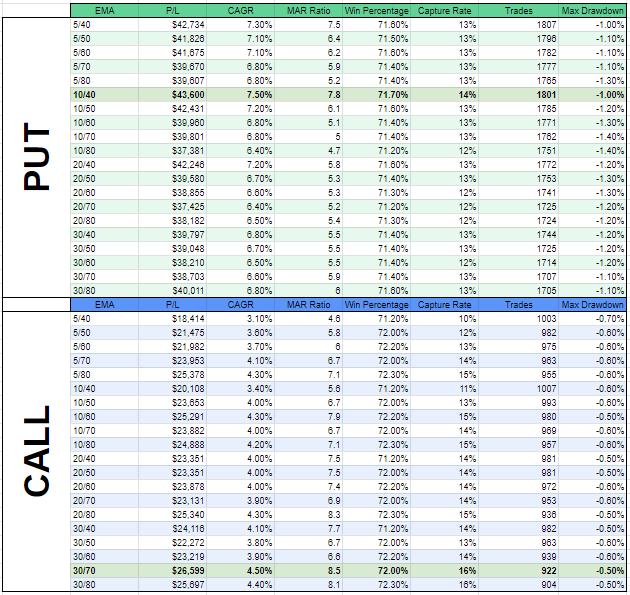
Do the same for those rows I want and format it abit. This is the end results.
Still it's not visually appealing, let's do a MAR chart.
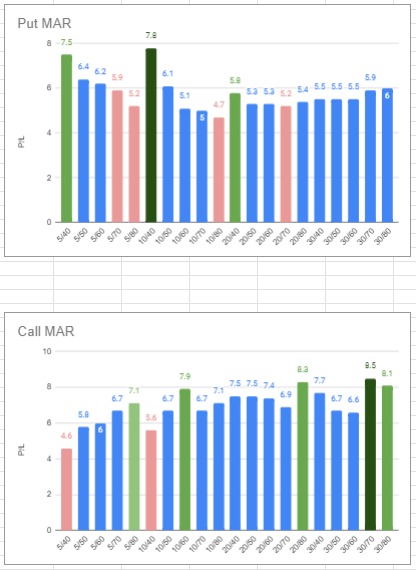
I manually changed the color of the best and worse bars to make them more obvious. Now there's a good visual of which one did better and which one sucked.
The interesting results of this study is Put has a very different best than Call in terms of which EMA to use. And the best of Put, which is 10/40 ema, is almost the worst of Call. This kinda suggest to me I should use different ema for put and call entries.
I hope both the study itself and how I did this study helped anyone interested. Not sure if this way of writing will be too complicated or messy. Anything please find me on discord.
Before I forget, for whoever interested. This is the ipynb file for download too.


Member discussion